Color-color reality check
-
 by
jules
moderator
by
jules
moderator
Well these are hardly earth shattering results but I thought I’d share anyway. Decided to play with some color-color diagrams both to get used to them and to using Tools. I looked at several combinations of colours for a number of subsets of the data for both QS and QC namely: edge-on galaxies, spirals, galaxies with and without bulges, clumpy galaxies, merging and not merging galaxies and symmetrical.
Result – no surprises! All QS galaxies are not too blue and not too red as they should be. Firmly in the green valley. All QC subsets have a wider spread of colours. A reality check is no bad thing I suppose – and my data analysis skills don’t allow me to go further just yet.
As an illustration here’s my Non-mergers dashboard.
http://tools.zooniverse.org/#/dashboards/galaxy_zoo_starburst/5207b2c4be70a62e87000084
A couple of things of note – I kept coming across 3 noteable“outliers”. Two, from QS, are in Jean’s excellent Outliers collection:
A blob in the outskirts of edge-on NGC4157 20588295842324021329 AGS00000to
A star in front of a spiral 20587736543633867051 AGS00001ka
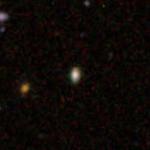
Another one, from QC, noteworthy for being off the blue scale though not really an outlier, is, I believe, an OIII "Pea" 588848901515182119 AGS00002wk
Posted
-
 by
JeanTate
in response to jules's comment.
by
JeanTate
in response to jules's comment.
Nice work jules! 😃
588848901515182119 AGS00002wk is indeed a starburst, an "HII galaxy". Super-zooite (I prefer this to 'super-user') c_cld wrote this about it, in a post in the GZ forum (November 22, 2010):
588848901515182119 SDSS J104554.77+010405.7 HII_G z=0.0262
paired with
588848901515182120 [WCH93] 1043+0119 -- Possible Quasar, QSO_CandidateAnd yes, it appears in the Give Peas a chance! thread, in a post by starry nite (March 04, 2008), titled "OIII Galaxy Catalog (Part One, z=0 to 0.1100)" 😉
Your two color-color scatterplots - (u-r) vs (g-r), for QS and QC - show an interesting difference, an absence of redder objects, as measured by (u-r).
I too did a pair (QS, QC) of color-color plots. But I used (g-r) and (r-i); why? Because the images we got to classify are derived from the g, r, and i band images, and the colorization algorithm used boosts color differences (there's a neat paper, by Lupton, I think, on this; I'll see if I can dig it up). In this pair of plots, QS (left) is like almost a triangle-shaped cloud, while QC (right)1 is much more spread out, a fat line with a warp at each end (I fixed the x- and y-axes ranges to be the same):
http://tools.zooniverse.org/#/dashboards/galaxy_zoo_starburst/520b64d9e917ff0dc600047c
From the QS plot, it's clear why so many QS objects seem white! The heart of that triangle-shaped cloud corresponds to various shades of white, as these examples make clear:
(g-r, r-i)
=(0.51,0.30) . . . . . . . . . . . (0.6, 0.4) . . . . . . . . . . . . . . . . . . . . . (0.8, 0.35)AGS000017q . . . . . . . . . . . . . . . . . . . . . . AGS00000wn . . . . . . . . . . . AGS00000mc
1 I haven't yet worked out how to label scatterplots; may I ask how you did that?
Posted
-
by
jules
moderator
There's a definite trend towards an absence of redder objects in QS - though that's to be expected. (isn't it? hope so!) I just had a look again at one of my other subsets: Bulgeless galaxies, and the difference is quite marked - more so I think than for comparisons of any other subset or of the whole dataset. I also used (g-r) and (r-i) on this subset (though I can't own up to knowing why!) and the results are quite striking - though in a kind of predictable way...
Here's the dashboard if you want to take a peek (they load really slowly for me.)
http://tools.zooniverse.org/#/dashboards/galaxy_zoo_starburst/5206923f0aab2a2183000281Double left click on the word scatterplot and a box should appear to rename it. Sometimes I have to refresh for this to work - or even to close down the dashboard and re-open it. Annoying!
Posted
-
by
JeanTate
in response to jules's comment.
Thanks for the tip on renaming scatterplots! I tried it, and changed the names in my dashboard (I think I'd tried it before, but it didn't seem to work).
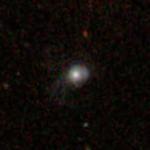
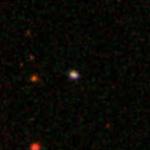
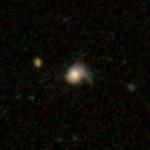
Here are four QS galaxies that have almost archetypical E+A spectra, all in the triangle-shaped cloud (in my (g-r) vs (r-i) color-color plot); notice how they get redder as redshift increases:
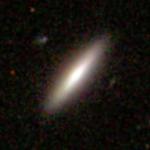
(0.58, 0.29; 0.015) . . . . . . . . . . (0.65, 0.31; 0.100) . . . . . . . . . . (0.87, 0.35; 0.198) . . . . . . . . . . (1.0, 0.37; 0.276)
AGS00001ne . . . . . . . . . . . . . . . . AGS00001hb . . . . . . . . . . . . . . AGS00000i0 . . . . . . . . . . . . . . AGS00000vm
And here are their spectra (same order; first, second, third, fourth):
Posted