Mass Dependent Merger Fraction (Control vs Post-quenched Sample)
-
 by
trouille
scientist, moderator, admin
by
trouille
scientist, moderator, admin
If you've just read Part 4 of the How-To-Guide and would like to participate in the follow-up discussion here, please do!
Posted
-
 by
JeanTate
by
JeanTate
Very early in that blog post you write:
That’s a statistically significant difference and ...
I'm sure you're right, but how can you tell - just by looking at the two numbers - that the difference is statistically significant?
Posted
-
by
JeanTate
For those who may not have read them, there are some interesting - and relevant - comments on Laura's GZ blog post. I'll try to copy them here:
[zutopian says: September 16, 2013 at 5:58 pm] I am not familiar with this GZ side project and Tools.:
I didn’t classify and I haven’t done posts in Talk. Besides I have technical problems with Tools.: I use IE10. I can view shared dashboards/view a galaxy from Talk in Tools, but I can’t create dashboards.: When clicking Data, nothing happens.
Actually, I would like to comment concerning merging galaxies.:
At your dashboard “4blog Merger Fraction” there is given “298 total items” in “Control Merging”, but in your blog post however you cite “Control mergers (245)”. I wonder, why there is a difference? Do I miss something? Well, I found another different number in the control sample data, which I had downloaded.: 276 Mergers (127 tidal and 149 merging). That’s confusing!
Besides I checked a few IDs and I found following one, which is however classified as merging in both dashboards and also in the downloaded data, but actually it isn’t a merger, because the 2nd object is a star! AGS00002e5
[zutopian says: September 16, 2013 at 8:54 pm] In addition to my previous comment:
The following one is from the Q-Sample and classified as merging, but actually it isn’t a merger, because the 2nd object is a star according to the spectrum chart! AGS000006k
[Michael Zevin says: September 16, 2013 at 8:42 pm] I’ve heard of some others having issues with tools when using IE, I’d recommend using another browser when using tools – I use Chrome and it works great with tools.
As far as the discrepancies with the number of merging control galaxies, it probably has to do with the filter you applied on the data. During classification, there were 4 options you could select to identify if the galaxy showed signs of merging: Merging, Tidal Debris, Both Merging and Tidal Debris, or Neither. Since we are looking at galaxies that show any signs of a merging event, we want to include the galaxies that were identified as ‘Merging’, ‘Tidal debris’, and ‘Both’.
You can do this by applying just 1 filter. Instead of filtering all 3, you can just filter out the galaxies that do not show any signs of merging. The prompt for the filter should look like:
filter .Merging != ‘Neither’
which is just saying ‘filter only galaxies that have some sort of merger signature. When I did this I got 298 of the control galaxies with merger signatures.
You are definitely right about the false-positive merging galaxy, it sure is a star in the foreground field and not part of a galaxy merger. Unfortunately, things like this are bound to happen (hopefully not too often) when using galaxy zoo – most people saw it as a merging event and classified it as such. During classifications, people also cannot click on the objects (as you can in the SDSS navigation) to confirm whether something is a ‘star’ or a ‘galaxy’. The power of galaxy zoo though is the number of classifications – even though a few samples may be classified wrongly we will have many many more that are classified correctly!
[zutopian says: September 16, 2013 at 9:30 pm] Thank you for your reply. While I was sending a comment (at 8:54 pm) about another similiar case, you replied.: I picked again a wrong classifaction and I have just checked a few IDs so far! I am skeptical concerning the reliability of the classifications. I think, that especially all merger classifications should be checked by the science team.
[zutopian says: September 16, 2013 at 11:14 pm] So I forgot to add the option “both (merging and tidal)”. I reviewed the downloaded control data.: 13 both +127 tidal+ 148 merging= 288
(In my 1st comment I wrongly added “149″ merging)There is however still a difference! 288 versus 298
Well, I know the answer.: There are 9 star/artifact classifications in the downloaded control data. However, they are also in the “control galaxies with merger signatures” sample! This “Merger sample” should be actually without “star” classifications. I think, that the science team should check, if these are really stars!
Finally: 13 both+ 127 tidal+ 148 merging+ 9 STARS= 297 (+1 ???)
I checked the counts, of objects in the v3 QC catalog, and confirm what zutopian wrote ... and also discovered the "+1 ???" (it's AGS00004n1, an object which should not have been included, and which has a 'merging' classification of 'null'):
- Neither: 2705
- Merging:
149148 - Tidal debris: 127
- Both: 13
- null: 1
Total: 3003
UPDATE: I edited the 'merging' total; it's actually 148 (not 149)
Posted
-
 by
mzevin1
scientist, moderator
by
mzevin1
scientist, moderator
Thanks Jean/zutopian!
We'll definitely have to check out if the amount of wrong classifications of mergers and nonmergers will be statistically significant. I'm guessing that most of the ones wrongly classified as mergers had foreground stars that people believed were galaxies. Depending on the frequency of this we may have to go through the galaxies classified as mergers and double check with the spectral data to confirm - looking at merger signatures is really important to the science goals of this project, and we have to make sure that these classifications (for the most part) are correct!
Posted
-
by
JeanTate
in response to mzevin1's comment.
You're most welcome, mzevin1! 😃
I suspect there are several classification biases that we need to at least get a handle on. For example, a small check that I did shows that most, perhaps nearly all, objects classified as 'smooth, cigar-shaped' are actually disk galaxies (rather than E6 or E7 ellipticals, say), and that there's little to distinguish these from 'disk, edge-on' disk galaxies. Also, in at least half the redshift range, QS objects are systematically smaller than QC objects with the same redshift (on average, as measured by petro_r50, ...). If anyone is interested, I'll provide links to threads where these findings are posted ...
Posted
-
 by
zutopian
by
zutopian
This is my 1st post in GZQ Talk.:
You are welcome, mzevin! Thank you, Jean!@mzevin
As I asked before, please remove the "star" classifications from the merger samples. The "Merger" data in Tools includes "Merging","Tidal","Both" and wrongly also "STAR" classifications.
Besides the merger classifications, the science team should check also those star classifications.: QS: 8 stars, QC:9 stars.
Besides the "null" classification AGS00004n1, which Jean mentioned, should be deleted.Posted
-
 by
mlpeck
by
mlpeck
I made a post about the objects classified as stars or artifacts in the quench sample shortly after the classifications became available. I had already removed one of the 8 from my personal database because it actually was a star or artifact. There was one that was understandably misclassified and 6 galaxies obscured by glare from nearby bright stars. I think there is also one isolated star that was misclassified as a galaxy.
In the control sample there is one z=0.16 galaxy that's sitting behind the disk of a nearby and much larger galaxy. The photometry and some derived characteristics (stellar mass for example) for that object are completely wrong, as I'm sure JeanTate has pointed out multiple times. In addition there is one starforming clump in a nearby galaxy, one odd looking thing with a measured redshift z=0.19, and 6 galaxies obscured by glare.
The GZ classifiers seemed to have problems with glare.
Posted
-
by
zutopian
Copy of my comment from the blog:
zutopian says: September 17, 2013 at 12:30 pm
I continued to check further classifications.: Here is a case, which is actually cleary a merger, but however it is classified as “Neither”.
I am astonished! (Please confirm, that there is given “Neither”: QS data).
http://quenchtalk.galaxyzoo.org/#/subjects/AGS0000022
So here is a merger, which had been missed and curiously it is an obvious one, but in the previously mentioned cases, the classifications as “merger” are wrong!EDIT:
Please correct this classification!
Since some classifications have to be corrected, I think, that currently it doesn't make much sense to analyse data, does it?Posted
-
by
JeanTate
in response to mlpeck's comment.
The GZ classifiers seemed to have problems with glare.
The extinction-removal and k-correction routines seem to have a similar problem. Here is AGS00000s1; the 'corrected' i-band magnitude is 11 mags fainter than the DR7 photometric pipeline's modelmag. And the u-band one, 8.3 mags fainter; the g-band 2.9 mags brighter, r-band 2.6 mags, and z-band 2.0 mags brighter.
Posted
-
by
JeanTate
in response to zutopian's comment.
The challenge - well, one challenge - is how to decide a) what is an outlier, b) which outliers to remove, c) from what analyses. And to do so consistently, across both the QS and QC catalogs.
For example, mlpeck has pointed out1 that at least some of the galaxies close to very bright stars have quite acceptable spectra, even if the photometry (and zooite classifications) is wonky. Such objects should surely be included in analyses done using only spectroscopically-derived data, right?
1 somewhere here in Quench Talk; even if I could find where, I couldn't provide a link to the post anyway
Posted
-
by
zutopian
Here is a new paper, in which Galaxy Zoo is acknowledged.:
Automatic quantitative morphological analysis of interacting galaxies
Lior Shamir, Anthony Holincheck, John Wallin
(Submitted on 16 Sep 2013)
http://arxiv.org/abs/1309.4014
It might be useful for the merger samples in this project.
Posted
-
by
trouille
scientist, moderator, admin
Hi all,
I just returned from the .Astronomy conference in Boston and am catching up on the week in Quench.
And I'm happy to begin with a BIG THANK YOU ZUTOPIAN AND OTHERS! Yes, there's definitely an error in the classification scheme. We've looked into the details and it's actually quite interesting.
For zutopian's initial example (http://quench.galaxyzoo.org/#/examine/AGS0000022), If we break down how many votes went to each category, we get: 3 people said it was a merger, 5 tidal debris, 7 neither, and 5 both. Therefore, Tools lists 'Neither' because that's the category that gets the most votes.
So, the data reflects what we told it to do. In this case, though, the most common answer is misleading; 13/20 people thought there was SOME kind of merging going on in the galaxies (merger, tidal debris, or both), and so this really should go into the "merger" side of the classifications.
When we set the rule for how Tools would list final classifications, we didn't think of the cases where more people would directly vote for 'Neither', but if you add up 'merger + tidal debris + both', you could get more votes than 'Neither'.
So we've learned that we need to change our algorithm for how we set the final classification result.
It's AWESOME that you all identified this mistake and wrote about it.
But I realize that for some, this experience may feel quite frustrating. But please please remember that this is a major part of science and being in a science team. Double checking and revising and moving forward. Science is both big picture and detail oriented. Science teams do best when there's a mix of people with a mix of skills on both ends of that spectrum. So lucky that our team has that!!
Posted
-
by
zutopian
You are welcome! It is good news, that zooites actually had recognized, that there is some kind of merging going on. I wonder, how the new algorithm will set the final classification results? It will be interesting, how the new results will be after changing the algorithm. How will be the effect concerning "missed" mergers? And will there be any effect concerning wrong merger classifications (e.g. AGS000006k)? Will the quantity of wrong merger classifications increase? I think, that it is actually okay, that first there are some "wrong merger" classification results, but those should be corrected by the science team.:The science team should check all merger classifications. When will the new results (new algorithm and wrong classifications corrected by science team) probably be available? BTW, the new algorithm is also relevant for the main GZ project.: There are SDSS and HST/CANDELS images.:For the CANDELS images there are also as in GZQ the 4 options "merging","tidal debris", "both", "neither".
EDIT:
What about the classification result currently and after changing the algorithm, when a result is actually "undecided", e.g. 10 neither and 10 merging ? - also applies to other classifications: e.g. 10 smooth and 10 feature/disk. (As far as I know, in GZ1/GZ2 there are some classification results as "uncertain". (I guess, when it is an "undecided" or an "unreliable" classification result.))PS: Here is my collection, which contains some "missed mergers": http://quenchtalk.galaxyzoo.org/#/collections/CGSS0000cv
and here is my collection "wrong classifications", which contains some wrong/missed mergers and some other wrong classifications.: http://quenchtalk.galaxyzoo.org/#/collections/CGSS0000ctPosted
-
 by
jules
moderator
by
jules
moderator
I suppose this is just one reason why scientific papers take so long to publish. One thing I've learned from this project is that making sure the data makes sense is an important, and not necessarily straightforward, part of the process. Great that these misleading classifications have been picked up. As I have been working with a set of mergers I look forward to developments.
Posted
-
by
JeanTate
in response to trouille's comment.
It is indeed good - awesome even - to see that ordinary zooites can be just as discerning (have eyes that are just as sharp) when it comes to numerical data, as they are in classifying galaxies, morphologically.
I wonder, however, if we - collectively - might not have uncovered these things an awful lot faster if ordinary zooites had had access to all the classification data; what do you think?
Also, it's screamingly obvious that both the QS and QC contain objects which are not galaxies, yet these were not removed, going from v2 to v3; why?
Back on September 3, I started a thread called What is needed to get a clean QS and a clean QC? Yours truly, jules, and mlpeck are the only contributors to that thread; no SCIENTIST has posted there. In fact, the last post ends with this, rather down, note:
I'd really like to get on with more substantive analysis, and I thought the graphs I posted in those two monologues suggested some interesting avenues to investigate. Unfortunately, given the complete absence of anyone from the science team for over a week now I've reached the conclusion that this project has failed, so for now at least I can't justify spending the time exploring those avenues more thoroughly
Posted
-
by
JeanTate
in response to zutopian's comment.
What about the classification result currently and after changing the algorithm, when a result is actually "undecided", e.g. 10 neither and 10 merging ? - also applies to other classifications: e.g. 10 smooth and 10 feature/disk. (As far as I know, in GZ1/GZ2 there are some classification results as "uncertain". (I guess, when it is an "undecided" or an "unreliable" classification result.))
This raises something very important that's been bothering me for some time.
Reducing a dozen or so zooite answers to a question to a single word - "How prominent is the central bulge, when compared with the rest of the galaxy?" becomes "Obvious", for AGS000024z for example - throws away a great deal of potentially valuable data. Back in GZ1 the distribution of classifications (answers) was used as the starting point for some very interesting science, from mergers (the Darg et al. papers, for example) to development of the SPRC (Sloan-based Polar Ring Catalog, Moiseev et al.).
Several Quench project questions have answers which are clines, not discrete states:
- How rounded is it? (some sort of numerical mean of the answers would
convey much more information about the likely ellipticity than merely
picking the modal response); - How tightly wound do the spiral arms appear? (ditto);
- How prominent is the central bulge, when compared with the rest of
the galaxy? (ditto)
Several others seem binary (ternary), but if the distribution of responses is converted to a numeric mean more scientifically valuable information would be captured; for example:
- Does the galaxy appear symmetrical? (a numerical mean would likely be a proxy for the degree of asymmetry, which would be much more interesting than the modal response)
- Does the galaxy have a bulge at its center? (ditto)
- Is there any sign of a bar feature through the center of the galaxy? (the feature a numerical mean would likely be a proxy for would be 'bar strength')
- Is there any sign of a spiral arm pattern? (ditto)
- Could this be a disk viewed edge on? (in this case a crude proxy for inclination)
- Are there any off-center bright clumps embedded within the galaxy? ('estimated number of bight clumps' is better than 'none', '1', or '>1')
For two questions the extra information the distribution of answers contains might be harder to unpack with just a numeric mean:
- Is the galaxy merging or is there any sign of tidal debris? (as this is two questions combined into one, it's probably best to create two - even three - separate fields; e.g. a 'tidal tail' score, a 'merging' score, and a combined 'interacting' score)
- Is the galaxy simply smooth and rounded, with no sign of a disk? (as this question is at the head of the decision tree, it's not obvious how to convey the detailed information the distribution of answers contains; however, it's particularly important to at least indicate the degree of unanimity among zooites' votes, a 'features 49%/smooth 51%' classification is very different from a 'features 95%/smooth 5%' one!)
What do you think?
Posted
- How rounded is it? (some sort of numerical mean of the answers would
-
by
jules
moderator
All good points Jean and food for thought. Apologies for my absence of late - a busy week together with an infuriatingly timed heavy cold has put paid to much serious thinking for a while! As soon as the fog clears I'll be back to these important questions - the algorithm determines the science so we need to be sure it's right!
Posted
-
by
zutopian
Merging Classification Problem Fixed! Quench Boost 4 take 2.
Posted
-
by
JeanTate
in response to jules's comment.
I'll soon/later be starting a new thread, somewhere, to have a discussion on "the process". One of the main things I'd hoped to get out of the Quench project was (and still is, actually) a far better insight into what's actually involved in working with a team, to do analyses and write a paper, one good enough to be submitted to a peer-reviewed journal. Yes, we zooites who have been classifying QC and QS objects, using Tools to do analyses, downloading data and crunching it, etc are part of a scientific team. However, we are surely quite unlike a regular team of astronomers!
One surprise for me: we do not have access to the raw data, nor do we know - in detail - how objects were selected. I had thought that these two things were absolutely critical, in terms of doing research (of course, a particular team member may not be involved in a particular analysis, and so not want to have the raw data, or know about the selection process, but they'd surely be able to get both, if they asked).
Posted
-
by
jules
moderator
Given all the caveats in this thread and others about the quality of the data I have nevertheless followed up on the how-to part 4 blog post in the way that Laura suggests. Using just the 3 mass bins I came up with the following plot. I am now working on narrowing the bins to squeeze more detail out of the data and will write up in more detail when done. For now, this clearly shows that the fraction of galaxies that show merger signatures increases with mass in both Quench Control and Quench Sample groups and the increase is more marked in the Quench Sample.
I admit to being at a loss with what version of the data we are up to and how clean it is - and whether it even matters if it's not perfect - but I thought I'd plod on anyway. I can always use the tables I have on my dashboards with any new dataset that comes along. So.... not very exciting, but here it is. The narrower bins are looking more promising but I have a way to go yet.

Posted
-
by
mlpeck
I wonder how important selection effects are in some of these relationships. Here is an issue that's a direct consequence of the fact that the SDSS sample is magnitude limited and that there were no obvious redshift or magnitude cuts in the sample selection for this project:

This plots (log) stellar mass against (log) redshift for both the quench (red dots) and control samples. The samples were selected to have the same mass and redshift distributions, and as this graph shows they have basically the same joint distribution in (redshift, mass).
So, the question arises, is an apparent systematic relationship of some quantity with mass really a relationship with distance? And how would we tell?
Posted
-
by
zutopian
in response to mlpeck's comment.
Here is an issue that's a direct consequence of the fact that the SDSS sample is magnitude limited and that there were no obvious redshift or magnitude cuts in the sample selection for this project:
I had cited following statement from the Wong et al paper in the "Sample Selection" topic, on page1..:
To minimise the Malmquist bias, and create a volume and magnitude-limited (proxy for stellar-mass limited) sample of galaxies, we select all the galaxies within 0.02 < z < 0.05 with Mz,Petro <−19.5 magnitudes.
http://arxiv.org/abs/1111.1785
Posted
-
by
zutopian
in response to mlpeck's comment.
So, the question arises, is an apparent systematic relationship of some quantity with mass really a relationship with distance? And how would we tell?
I guess, that following topic is related.:
Does our Quench data contradict Hubble's Cosmos survey conclusion?
http://quenchtalk.galaxyzoo.org/#/boards/BGS0000008/discussions/DGS00001x5Posted
-
by
jules
moderator
Warning - long post!!
I had another look at mass dependent merger fractions using 6 narrower bins for log mass:

Bins:
> 0 < 10
> 10 < 10.3
> 10.3 < 10.6
> 10.6 < 10.9
> 10.9 < 11.2
> 11.2
In QS the fraction of galaxies that show merger signatures increases with mass. The merger fraction plateaus between log mass 10.2 and 10.5 and then rises rapidly. In QC the fraction of galaxies that show merger signatures actually decreases for galaxies of less than log mass 10.5. After that the fraction begins to increase though at a much slower rate than galaxies of comparable mass in the QS. Something appears to happen when both QS and QC galaxies reach a log mass of around 10.5 to trigger an increase in the number involved in mergers. Something also happens to QS galaxies below log mass 10.5 to prevent the merger dip seen in QC.
Higher mass galaxies, above log mass 10.5, are, therefore, the ones most likely to show signs of merging and this is more pronounced in QS galaxies.
I decided to look closer at the differences between low and high mass merging galaxies to see what effect mass has on quenching star formation.
Here are BPT diagrams of QS for low mass galaxies (log mass < 10.5) and high mass galaxies (log mass > 10.5).

Here are the same BPT diagrams for QC which show similar though more dispersed results.

The numbers are interesting:
QS log mass < 10.5 n=150
QC log mass < 10.5 n=120
QS log mass > 10.5 n=437
QC log mass > 10.5 n=184
The number of high mass QS merging galaxies is striking (if not statistically significant!)
Higher mass merging galaxies appear to (pretty much) quench star formation and drive AGN activity in both QS and QC though the effect is much stronger in QS.
Darg found that:
“the star-forming types occupy the smaller mass regions which are
dominated by spirals and the quiescent types occupy the higher mass
regions, which are dominated by ellipticals. The AGN categories seem
to occupy the intermediate mass region.”I’m not expert at reading BPT diagrams. In the above high mass BPT diagrams I haven’t defined a category for “higher mass regions” but there are some points that seem to stray off the AGN arms of the high mass (log mass > 10.5) plots – could these be the quiescent ellipticals? I don’t know without looking them up individually but if so then my diagrams support his findings.
OK – I looked up 6 of these “strays”, 3 each in QS and QC and they all look red and dead to me.
QS
587739721374695400 log mass 11.1
588017978908016900 log mass 10.7
587730775482368600 log mass 11.0
QC
587742014356193400 log mass 10.6
587739305289449600 log mass 10.6
587738407866921100 log mass 11.5
The highest value for log mass in both QS and QC is 11.7.
I also had a look at morphology and divided both the low and high mass groups of mergers further into those containing signs of spiral arms and those that did not and created some BPT plots. However, I think the results are of limited value. As only the central galaxy in each image was classified any accompanying spiral would be missed so the number of spirals is likely to be underestimated. The number in each group is very low anyway (especially the “low mass/spiral/not spiral features” groups with numbers from 24 – 44). That said, a quick summary of what I found is that all high mass galaxies, both QS and QC, whether involving spirals or not are AGN driven and star forming has been quenched. Wong discusses current models of galaxy evolution including the prediction that AGN feedback quenches star formation but notes that this effect is likely to be redshift dependent.
Both QS and QC low mass galaxies with and without spirals show both star formation and AGN features though QS and QC with spirals show greater star formation. A tentative conclusion might be that AGNs in mergers do not require spirals to drive them but spirals trigger more star formation in low mass merging galaxies.
Conclusions:
There are differences in high mass and low mass mergers in terms of how / whether star formation is quenched. This supports Kaviraj’s evidence that massive post-quenched galaxies require different quenching mechanisms from lower-mass post-quenched galaxies.
For both QS and QC, low mass mergers drive both star formation and AGN activity.
Higher mass galaxies are more likely to show signs of merging than low mass galaxies and this is much more pronounced in QS galaxies.
These high mass mergers quench star formation and drive AGNs and this is more notable in QS. This latter point is the same conclusion mlpeck reached via a different route here.
What I still don’t know is – why the apparent change at log mass 10.5?
Why does the fraction of QC galaxies that show merger signatures decrease as mass increases for galaxies with log mass < 10.5?This is still unfamiliar territory – so please excuse (and correct!) any glaring errors. I also realise the data still needs cleaning but I have gone ahead anyway on the basis that I can re-do any plots once we have a clean sample and that in this case it might not make a great difference to the results anyway.
Dashboards
BPT merger/spiral plots v log mass < 10.5
BPT merger/spiral plots v log mass > 10.5
Posted
-
by
mlpeck
in response to jules's comment.
Interesting post which I haven't had time to digest yet, but I'm glad someone is still trying to do some analysis. One comment for now, and one question:
What's your definition of "merger signature"?
OK – I looked up 6 of these “strays”, 3 each in QS and QC and they all look red and dead to me.
The 3 QS galaxies you linked all have pretty strong Balmer absorption lines + weak emission, which makes them likely "E+A" galaxies. They also looked early type to me.
The QC galaxies truly do look "red & dead."
Posted
-
by
jules
moderator
My definition of merger for the purposes of the merger fraction v log mas plot is defined by the filter "filter .Merging != 'Neither'." This includes the answers "merging," "tidal debris" or "both" (and now "disturbed)" to the question "Is the galaxy merging or is there any sign of tidal debris?"
Does that help? Let me know if I've missed your point.
Thanks for the comments on the strays - I'll take another look at the spectra. Not my strong point!
Posted
-
by
mlpeck
in response to jules's comment.
Jules:
Does that help? Let me know if I've missed your point.
Yes, that helps. I was just making sure we had the same definition of "merger signature," which we do.
So the merger fraction (as seen by the GZ classifiers) increases with stellar mass, and AGN activity also increases both with stellar mass and signs of merging.
Posted
-
by
zutopian
in response to zutopian's comment.
Question asked by rudolfbaer in the other GZ Talk :
with the quench data I plotted red-shift vs (log) mass. I get an upwards sloping curve. Is there an actual correlation?
Reply by Brooke in the other GZ Talk, two months ago.:
Sorry for the delay in answering; but that sounds normal to me.
When we observe with a telescope, we're generally limited to seeing things above a certain flux limit, where by "flux" we mean the observed brightness. (Magnitude is a logarithm of the flux.)
Of course, we're more interested in an object's intrinsic properties, i.e., how bright is the light bulb intrinsically, as opposed to how bright it was observed. So we use measures of distance, such as redshift, to convert from observed brightness to intrinsic.
What that means, then, is that a constant observed brightness limit translates to a varying intrinsic brightness limit: as we look farther and farther away, we lose the ability to see the fainter objects. So if you were to plot redshift versus absolute magnitude (or luminosity) you'd see that the luminosity of objects seems to get higher as you go to higher redshift -- but that's purely a result of what the telecsope is able to observe in the first place.
And, of course, because luminosity is related to how many stars there are, and so is mass, you'll see that same limit echo through to mass: we can only detect the lowest-mass stuff if it's nearby.
You can see this in plots here: http://tools.zooniverse.org/#/dashboards/galaxy_zoo_starburst/52249c01e1e4673995000008
Hope that helps!
--BrookePosted
-
by
jules
moderator
in response to mlpeck's comment.
"So the merger fraction (as seen by the GZ classifiers) increases with
stellar mass, and AGN activity also increases both with stellar mass
and signs of merging."Yes - that does appear to be the case.
Posted
-
by
jules
moderator
in response to zutopian's comment.
Thanks for copying that over zutopian - that's actually quite useful.
Posted
-
by
trouille
scientist, moderator, admin
Great posts Jules!
The first result you post (about mass dependence of merger fraction) is definitely one we should follow up on.
Could you remake your plot of merger fraction vs mass, but including error bars? The first order way of finding errors for your plot is to do:
error = square_root [# of sources in this mass_bin showing merger signatures] divided by the total number of sources in this mass_bin.
Your result is then: merger_fraction_in_given_mass_bin +/- error
Your error should be slightly different for each point on your plot since there are different numbers of sources in each mass bin. Your error bar length is equal to your error (use the full length for both the error bar above the value and the error bar below your value).
We'll then be able to see if the error bars overlap for the Quench versus Control sample. If they don't, that can be an indication that this is a statistically significant result.
Posted
-
by
jules
moderator
I'll give it a go. Give me a few days though - internet is dodgy again!
Posted
-
by
trouille
scientist, moderator, admin
Our next step could be to see if there are additional errors we need to consider. For example, would you or someone else like to redo this same plot, but first applying a range of magnitude and redshift cuts? This will help us see whether the mass dependence we see is real or a result of a skewed sample.
We would not need to apply as drastic a redshift and magnitude cut as Wong et al. (2012, see quote below). One way to do this empirically is to progressively apply stronger cuts and see the impact on the results.
I would start by first seeing the change on the plot if you restrict the redshift to z LT 0.05, z LT 0.08, z LT 0.1, z LT 0.2, and z LT 0.4.
It'll be useful on this series of plots to include the error bars, because I can imagine the number of sources will be quite small when you reach z LT 0.05. I'm particularly curious -- do we still see the trend for z LT 0.08?
And similarly, we should test what the impact is of putting in different z-band magnitude cuts.
As others have quoted from the Wong et al. (2012) article:
To minimize the Malmquist bias, and create a volume- and magnitude-limited (proxy for stellar mass limited) sample of galaxies, we select all the galaxies between redshifts of 0.02 and 0.05 and absMag-Z brighter than -19.5 mag.Posted
-
by
jules
moderator
I may be some time... ;D
Posted
-
by
trouille
scientist, moderator, admin
😃 Of course. And for all -- this doesn't have to be done only or just by Jules. For all of these major results at this point, it'll be quite useful to have a few of us do the same plot, to double check each others' results. I plan to test this out as well and will share in this thread.
Posted
-
by
trouille
scientist, moderator, admin

A few, including Zutopian and others, have pointed out sample selection effects. I've seen the figure above in other threads, but thought it'd be helpful to bring here. The red sources are the brightest sources in the sample. The legend tells you what each color refers to. Red is for sources with absolute magnitudes brighter than -21.5. Yes, abs_mag is annoyingly confusing in that the more negative, the brighter the source. The red sources are also the most massive sources in the sample (as shown by where they lie in the y-axis. Brighter equals More Massive. That makes sense.
The plot helps us see why Wong et al. (2012) used an absolute magnitude in the Z-band cut of -19.5. Sources fainter than that (the blue in the plot) do not fill across the X-axis direction.
You can also see why Wong et al. (2012) put a redshift cut as well. They use a redshift cut of GT 0.02 and LT 0.05, which is shown by the vertical dashed lines.
If you consider the plot without the blue sources, it seems that we can push to slightly higher redshifts than 0.05 and still feel comfortable with our sample (in terms of how it covers the parameter space). For example, redshifts between 0.02 and 0.08 seem to have reasonable coverage for sources with Z_abs brighter than -19.5.
Posted
-
by
jules
moderator
Just checking I have read your error calculation correctly:
                          # of sources in this mass_bin showing merger signatures
       square_root  of     -----------------------------------------------------
                                the total number of sources in this mass_bin
Glad you mentioned redshift as that seemed to me the next logical step so I'll certainly have a go. Thanks for the feedback (and tips!) Much appreciated. 😃
Posted
-
by
trouille
scientist, moderator, admin
Good question about the errors. It's actually just the square root of the numerator. And then you divide that value by the denominator (i.e, the denominator is not in the square root).
Posted
-
by
jules
moderator
in response to trouille's comment.
Thanks. So:
                       square_root  of  (# of sources in this mass_bin showing merger signatures)
                       --------------------------------------------------------------------------------------------
                                             the total number of sources in this mass_bin
Posted
-
by
JeanTate
in response to trouille's comment.
The red sources are also the most massive sources in the sample (as shown by where they lie in the y-axis. Brighter equals More Massive. That makes sense.
Indeed.
So much so that I wonder whether estimated absolute magnitude is a good proxy for stellar mass?
Before that, do I remember correctly that someone - Laura? - posted r-band or i-band absolute magnitudes (corrected for galactic extinction and k-corrected); you posted z-band ones (corrected for neither, either, or both?). Is the difference significant?
A possibly confounding factor I think we should seriously examine: fiber covering fraction.
Leave aside - for now - spectra that come from fibers not centered on the galactic nucleus (yes, there are at least a handful of these), how does the placement of an object in the BPT diagram change as the fiber covering fraction goes from ~1 (e.g. for near-point source, high-z QS objects) to ~0.01 (e.g. for nothing-but-the-nucleus very local, very big spirals)? Beyond some redshift, QS objects are smaller than the corresponding QC ones, so the fiber covering fractions are different; is this systematic bias important?
Posted
-
by
zutopian
in response to JeanTate's comment.
Leave aside - for now - spectra that come from fibers not centered on the galactic nucleus (yes, there are at least a handful of these), how does the placement of an object in the BPT diagram change as the fiber covering fraction goes from ~1 (e.g. for near-point source, high-z QS objects) to ~0.01 (e.g. for nothing-but-the-nucleus very local, very big spirals)?
New topic by Jean:
What do BPT diagrams look like, if you select for fiber covering fraction?
http://quenchtalk.galaxyzoo.org/#/boards/BGS0000008/discussions/DGS000021y?page=1&comment_id=528405fe72c1094f2200034cPosted
-
by
zutopian
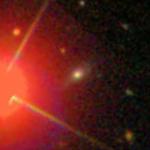
I refer to the posts at the begin of this topic, where I mentioned AGS000006k QS.:
Classified as merger. 2 spectra available.: Galaxy and Star.
Below there is the Stripe82 image, which I had posted on the forum a while ago. It looks like a merger and a star overlap.: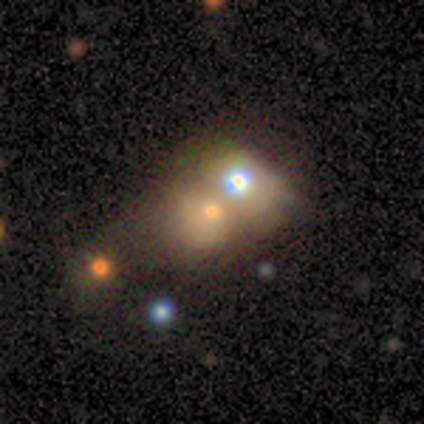
http://zoo3.galaxyzoo.org/examine/AHZ6000f0tForum topic: Star overlapping galaxy?:
http://www.galaxyzooforum.org/index.php?topic=280316.msg618669#msg618669Posted
-
by
JeanTate
in response to JeanTate's comment.
This raises something very important that's been bothering me for some time.
Reducing a dozen or so zooite answers to a question to a single word - "How prominent is the central bulge, when compared with the rest of the galaxy?" becomes "Obvious", for AGS000024z for example - throws away a great deal of potentially valuable data. Back in GZ1 the distribution of classifications (answers) was used as the starting point for some very interesting science, [...]
Recently SCIENTIST KWillett wrote this, in a comment to a GZ blog post (UPDATE: Next Live Hangout: Tuesday, 19th of November, 7 pm GMT; my bolding):
I agree with you that one can potentially lose a lot of information based on that; the range of probabilities that can be inferred from Galaxy Zoo is one of the strengths of the project. They’re in the catalog, but I almost always recommend that people use the vote fractions themselves (either as weights or by setting a threshold), rather than those classes.
(at his suggestion I created a thread in GZ Talk to continue the discussion; the full comment - and all the comments - are on page 1 of How to deal with 'blending' and 'shredding'?).
So, why are we - the zooites actively engaged in doing research that is intended to lead to a published paper - not able to work with "the vote fractions themselves"?
Posted
-
by
jules
moderator
OK - following on from my post and plots showing a statistically significant mass dependence in merger fraction (page 3), I have been working on adding redshift to the mix using the redshift bins suggested by trouille. I know the sample isn't perfect yet but I decided to go ahead anyway. I hope to post some results in the next day or two.
Posted
-
by
JeanTate
in response to jules's comment.
Cool!
One thing I'll be interested in is this: compared with what we end up with (in our paper), what are the differences?
Scattered through a dozen or two posts ('comments' I think is the correct term, for these Talk objects) in about as many threads ('discussions') are various forms of (my paraphrases) "we hope the outliers/anomalies don't matter", "there may be unrecognized systematic effects", "only a handful of obviously 'bad' datapoints need be removed", and so on. When all is said and done, we'll be able to see how important paying (extreme?) attention to detail is/was.
Posted
-
by
jules
moderator
Good point. Well here is a record of what things look like using the samples we currently have.
This is a redshift breakdown of my merger fraction v log mass graph (from page 3) using the current full QS and QC dataset (the negative log mass items get naturally filtered out).
I am about to do the same with the reduced dataset but was so far on with these that I thought I’d post anyway. I’ll not say much – they speak for themselves. The graph for redshift < 0.4 is a catch all reality check and thankfully matches my original attempt (yay!) though this one comes complete with error bars.

And the rest of the redshifts:

Better resolution version here.
Some errors are quite large – especially in QS. If you’re wondering why some points are missing it’s because there were no galaxies in that particular bin to record. Some of the numbers are pretty low too. There are only 49 QC galaxies and 43 QS galaxies in the z<0.05 bin for example.
And the change in gradient at log mass 10.4 / 10.5 is still marked for all redshifts in both QS and QC.
I’ll save the rest of the analysis for the smaller sample - when we're sure it's good to go!
Posted
-
by
ChrisMolloy
in response to jules's comment.
Hi Jules,
Could you supply a dashboard for redshift LT 0.4. I'm starting on the log mass redshift cuts and I just want to make sure I'm on the right track. I want to especilly look at the code/cut for z abs mag.
Posted
-
by
JeanTate
in response to jules's comment.
This is cool, jules!
I'm pretty sure I can guess - correctly - the answers to the following, but just to be sure ...
- does 'merger' include 'Disturbed'? Your earlier post (on p3) did not refer to this
- did you exclude the (admittedly very few) 'Star or artifact' objects, in either QS or QC, at any point?
- which version of the QS and QC catalogs did you work with? The latest is v4
- I found your switch of symbols for QS and QC confusing (QS=pink squares in one plot, QS=blue diamonds in the others)
- in the last plot - redshift < 0.05 - there are only three QC points; does that mean there are no QC objects with masses in the top two bins?
- in that same plot, the most massive QS bin has a merger fraction of 100% (I think); how many objects are there in that bin?
And a question for Laura: an error bar which goes above 100% is not meaningful, is it? Should they be truncated at 100%? or is there a different formula to use in such cases?
Posted
-
by
jules
moderator
in response to ChrisMolloy's comment.
Hi Chris,
I used a main table to perform each redshift cut in turn - rather than have a separate dashboard for each cut. I have so many dashboards I wanted to keep things simple! I set up 2 dashboards, one for QS and one for QC. In each I have the entire dataset on the left and the merger cut on the right. I've left them with z<0.4 set up.
QS http://tools.zooniverse.org/#/dashboards/galaxy_zoo_starburst/52a62eebb3ec4d0553000014
QC http://tools.zooniverse.org/#/dashboards/galaxy_zoo_starburst/529e3453134bb36c0400006e
HTH!
Posted
-
by
jules
moderator
in response to JeanTate's comment.
In answer to Jean's questions:
does 'merger' include 'Disturbed'? Your earlier post (on p3) did not refer to this
I used !=neither which now includes "disturbed." (I've checked the table - it does.)
did you exclude the (admittedly very few) 'Star or artifact' objects, in either QS or QC, at any point?
No - I didn't filter any further on the basis that I can redo the plots based on whatever final datasets we use.
which version of the QS and QC catalogs did you work with? The latest is v4
The plots were generated very recently using Tools. I haven't joined the CasJobs group yet - though I have an account from the Irregular days. Hopefully Tools is up to date with v4? It certainly should be.
I found your switch of symbols for QS and QC confusing (QS=pink squares in one plot, QS=blue diamonds in the others)
So did I! Thanks for pointing that out. Now fixed.
in the last plot - redshift < 0.05 - there are only three QC points; does that mean there are no QC objects with masses in the top two bins?
The highest mass bin is empty for QS and the top 3 bins are empty for QC. I should have repeated the bins - apologies. These are the 6 log mass bins I used:
> 0 < 10
> 10 < 10.3
> 10.3 < 10.6
> 10.6 < 10.9
> 10.9 < 11.2
> 11.2
in that same plot, the most massive QS bin has a merger fraction of 100% (I think); how many objects are there in that bin?
There are 4 galaxies in that bin (> 10.9 < 11.2)
The z < 0.05 plot is the most problematic with just 43 QS and 49 QC galaxies.
Hope that makes sense - thanks for taking the time to read and query!
Posted
-
by
ChrisMolloy
in response to jules's comment.
Thanks Jules.
Helpful!
Posted
-
by
jules
moderator
Here’s a quick and dirty look at the reduced 778 dataset and merger fractions. I couldn’t think of a way to match QS and QC as pairs so I just applied the same redshift filters to QC and came up with 808 QC galaxies.

Some points:
-
There are 6 redshift bins and so potentially 6 points on each line. Absent points equates to empty bins. You have probably noticed that the maximum number of points any line has is in fact 5.
-
This is because there is only 1 galaxy out of the entire QS and QC datasets in the highest mass bin (log_mass > 11.2). This is a QC galaxy. This one:
though in DR7 that ObjID points to a different galaxy. This is the correct DR7 ObjID: 587739828734591062
- Numbers of merger sig in each bin:
z < 0.05 QS 24 --- QC 32
z < 0.06 QS 52 --- QC 46
z < 0.07 QS 85 --- QC 59
z < 0.08 QS 126 --- QC 84
- Low numbers (particularly at redshifts < 0.06) and large errors must make these results questionable. However, the overall pattern is similar to that I found when using the larger sample.
I’ll have a closer look when I get time.
Posted
-
-
by
ChrisMolloy
Hi Jules,
Can you link the 778 QS dashboard. The cuts from Laura's filters aren't working for me. I get 887 and a blank screen when I input the z_absmag.
Posted
-
by
zutopian
in response to ChrisMolloy's comment.
Laura posted following 778 QS dashboard in the topic "Dealing with Sample Selection Issues" (page 3) some days ago.:
http://tools.zooniverse.org/#/dashboards/galaxy_zoo_starburst/52a6611c5b6a1304a0000027
Posted
-
by
ChrisMolloy
in response to zutopian's comment.
When I've used it nothing happens. Manually tried and when I enter the absmag filter, table is blank with 887 items listed.
Posted
-
by
jules
moderator
in response to ChrisMolloy's comment.
Oops - I meant to post the dashboard links. Here they are:
778 QS http://tools.zooniverse.org/#/dashboards/galaxy_zoo_starburst/52a74b425b6a1304ad000081
778 QC http://tools.zooniverse.org/#/dashboards/galaxy_zoo_starburst/52ab3cc35b6a1378300000f8
QS doesn't appear to be loading the data. It was fine yesterday. This is a common (for me) frustrating problem I have with Tools. Hope it works for you. I have the full 778 on the left and those with merger sigs on the right.
I've just tried again and removing the absmag filter results in the table populating again. Adding the filter back in and I get the same as you - blank table with 887 "items." This was working perfectly yesterday with the same filters in place so I assume this is a Tools issue. I'll check back later.
Posted
-
by
JeanTate
in response to jules's comment.
A bit late getting back to you jules, sorry.
Thanks for all the clarifications.
Just one I think we need to worry about, what to do with 'star/artifact' objects? As I explained in my recent post in the Asymmetrical Classifications thread, it's an extremely annoying thing: on the one hand, there are so few of these in 'the 778' that the results of our various analyses will (very likely) be the same no matter how we treat the handful; on the other, we should be consistent across all analyses ... but to do so we have to decide exactly what we're doing!
Specifically:
- if 'exclude', then this needs to be one of the first filters/cuts run
- if 'exclude', what to do about the counterpart object in the other catalog?
- if 'include', how to make sure these are added to all relevant fields? For example, in the v4 catalogs, the 'symmetrical' field is blank for 'star/artifact' objects, but it 'Neither' in the 'merging' field. How we decide affects how we calculate things like error bars...
Posted
-
by
jules
moderator
I agree Jean - entirely! The 778 are not perfect - yet. Also mlpeck suggested slightly different cuts (page 2) which would have produced a larger sample size. I don't know if this is being considered. I think I was working on the basis that once the sample was agreed and filtered for us I could easily revisit the tables and redo.
Posted
-
by
jules
moderator
All the ABSMAG columns have disappeared from QS. 😮 This would explain the empty tables in Laura's, Chris' and my 778 QS dashboards. 😦
They are there for QC.Could someone else confirm this please by just calling up new QS and QC tables in Tools and comparing the column headings? (as a sanity check for me if nothing else!)
It was all fine yesterday!!
Thanks!
Posted
-
by
ChrisMolloy
in response to jules's comment.
ABSMAG columns are missing for QS and QC. Also a lot of the data in different columns is now missing. Your dashboards loaded but blank. Something must be happening with tools so I might leave it for a day or so.
Posted
-
by
jules
moderator
in response to ChrisMolloy's comment.
Thanks for checking. I see absmags for QC just not QS. Something odd is happening. I've e-mailed a techie and await a reply.
Posted
-
by
trouille
scientist, moderator, admin
So bizarre. Thanks all for noticing this. Hopefully Ed (our Tools developer) will have the fix up quickly. He'll post here when it's done.
Posted
-
by
jules
moderator
Thanks Laura!
Posted
-
by
trouille
scientist, moderator, admin
in response to jules's comment.
Jules, great to see the mass dependence results still holding with the smaller sample of sources. I'd recommend with the smaller sample to use fewer mass bins (for example, 4 instead of 6 mass bins). That will put more sources in each bin and reduce the sizes of your error bars. I expect the trend with mass will be very similar.
Also, just out of curiosity and wondering how best I can share the matching control sources for the quench sample selection -- what are you using to make these plots? Is it in Excel? Or have you found a way in Tools to make comparison plots between the two samples? I had thought that wasn't possible yet (unfortunately).
Posted
-
by
jules
moderator
in response to trouille's comment.
Yes - I'm using Excel. It would be lovely if we could do something like this in Tools. I thought that using as many bins as possible would reveal more about the effect of redshift but this just resulted in rather large errors as you say. So I'll redo these plots. Less is more!
Posted
-
by
trouille
scientist, moderator, admin
in response to jules's comment.
OK. Good to know you're using Excel. What we could do for you is to provide you with .csv files that have the latest subsample selections that correctly match the Quench with the Control samples (i.e., remove the Control sample sources that correspond with the Quench sample sources that are removed).
I just posted in http://quenchtalk.galaxyzoo.org/#/boards/BGS0000008/discussions/DGS0000223 about subsample selection choices, with a response to Mlpeck's suggestion about using a wider redshift range. I'll add another post to that series requesting people to make .csv files available of both the Quench and Control subsamples that we decide upon using.
Posted
-
 by
edpaget
by
edpaget
Hi all. the absmags, values should now be back in the dataset. You may need to clear your browser's cache. I have no idea how they were accessible in the first place, since they were not in the dataset available previously. I'm going to guess weird cache magic.
Posted
-
by
jules
moderator
This will be pretty much all from me until the New Year now but I had some time today and here's the result.. Merger fractions and redshift now limited to the following 4 log mass bins:
>0.00 - <0.02
>0.02 - <0.04
>0.04 - <0.06
>0.06
All minus log mass galaxies have been filtered out but star / artifacts remain.
As before, to achieve a QC sample I just applied the same redshift and magnitude cuts as for QS.

I think the errors at redshift 0.05 will always be on the large side but at least there is now only one empty bin (at redshift 0.05 and log mass >0.06 there are no QC galaxies with merger signatures.) The overall trend is similar to previous plots - so can we now say that the mass dependence of merger sigs in QS galaxies still holds and is, therefore, real?
Google spreadsheet here: https://docs.google.com/spreadsheet/ccc?key=0AiDUiEX3VE3adGJfempOOEw0eXJOcnJsZm9fMjduRFE&usp=sharing
Tools dashboards here:
QS http://tools.zooniverse.org/#/dashboards/galaxy_zoo_starburst/52b0c28d4258ec578f000041
QC http://tools.zooniverse.org/#/dashboards/galaxy_zoo_starburst/52b0c44b2b60f16896000057
Posted
-
by
JeanTate
in response to edpaget's comment.
Really?!?!? 😮
I have no idea how they [the absmags values] were accessible in the first place, since they were not in the dataset available previously.
I downloaded both the QS and QC catalogs on 26 September, 2013, from Tools. As .csv files. In QS, between fields called "sfr" and "hdelta_flux", and in QC between fields called "abs_r" and "sfr", there are five fields, named:
- u_absmag
- g_absmag
- r_absmag
- i_absmag
- z_absmag
Later - today, with luck - I'll download the two catalogs again, from Tools. And compare them with my v4s. I'll write up what differences I find.
Do you mind if I ask, edpaget: What quality/version control do you (and the Zooniverse Development Team) use?
Posted
-
by
trouille
scientist, moderator, admin
Ed just let me know that the Tools Quench tables are back to 3002 sources each (and both tables have abs mags, etc.).
Posted
-
by
JeanTate
in response to jules's comment.
These results were posted by jules on December 5 2013, back on page 5:
Here is a plot similar to the top-right one ("Redshift <0.1"):

Per its title, the objects plotted are the 1149 QS and 1196 QC ones, which have redshifts between 0.02 and 0.10 AND estimated z-band absolute magnitudes brighter than -20.0. Some details:
- no 'soa' cut; whatever t00_a02 vote fraction an object has, it's included ("Is the galaxy simply smooth and rounded with no sign of a disk?" "Star or artifact")
- the criterion for classifying an object as "having a merger signature" is a t09_a03 vote fraction ≤ 0.500 ("Is the galaxy currently merging or is there any sign of tidal debris?" "Neither"); this is, I think, the same criterion jules used*
- the QS LOG_MASS values are those per mlpeck; the same as in the 11 April catalog except that "-1" values have been replaced (see this thread for details)
- "log mass" is binned in the same way as in jules' plot, starting at 10.0, bin width of 0.3, with the first bin as <10.0 and last bin >11.2 (see her post on p5 upthread for details)
- however, the x-axis values are the bin means, unlike in jules' plots
- error bars are calculated the same way as in jules' plots (see her post on p4 upthread for details).
*I am not 100% sure though; perhaps it's < 0.500, rather than ≤ 0.500
Posted
-
by
JeanTate
in response to JeanTate's comment.

As the plot title says, this is the same as that in the last post, except for the exclusion of "problematic" objects. Here are the details:
- there is a soa cut, T00_a02 vote fraction >0.3 objects excluded*
- objects flagged as ppo are excluded; see this thread for details
- objects with LOG_MASS values of -1 excluded
- the matched QC object for each excluded QS object also all excluded
- number of objects remaining after all the cuts: 1056 QS, and 999 QC.
At 10k m, there seems to be no significant change. However, both "clean" curves are (almost) monotonic, while the "all" ones are certainly not.
Next: calculate more realistic error bars, re-do with bins of ~equal numbers of objects per bin, examine different vote fraction thresholds, look into whether the obvious trends in these plots are different for different redshifts (i.e. repeat a modified version of jules' 'by redshift' plots). And just for fun I might plot the 'excluded objects'.
Questions? Comments?
*it's a redundant cut; the three objects cut (one QS, two QC) are all flagged as ppos anyway (see this thread for details)
Posted
-
by
ChrisMolloy
in response to JeanTate's comment.
At 10k m, there seems to be no significant change. However, both "clean" curves are (almost) monotonic, while the "all" ones are certainly not.
For the clean QC what are the fractions for the 3rd, 4th, and 5th bins? Presume bins 3 and 4 are the same?
Posted
-
by
JeanTate
in response to ChrisMolloy's comment.
Here's the full set of value±error bars:
All (1149, 1196) objects:
mean mass   9.84       10.17       10.44       10.73       10.99       11.32
QS fraction 0.111±0.025 0.160±0.021 0.154±0.020 0.318±0.043 0.453±0.084 0.750±0.433

mean mass   9.82       10.17       10.43       10.72       10.99       11.26
QC fraction 0.159±0.030 0.110±0.017 0.069±0.013 0.112±0.025 0.125±0.044 0
"Clean" subset:
mean mass   9.83       10.16       10.43       10.73       10.99       11.32
QS fraction 0.103±0.026 0.139±0.021 0.152±0.021 0.307±0.043 0.444±0.084 0.750±0.433

mean mass   9.83       10.17       10.43       10.72       11.06       11.24
QC fraction 0.134±0.031 0.101±0.018 0.073±0.015 0.081±0.023 0.105±0.044 0
Posted
-
by
JeanTate
in response to JeanTate's comment.
Next: calculate more realistic error bars,
In the How to derive physically real error bars, for fractions near 0 and 1? thread, I asked about robust method(s) for estimating 'error bars', for the kind of 'fraction' data we are focused on analyzing in this project.
I'm extremely glad I started that thread, and grateful to mlpeck, jtmendel, and klmasters for their posts/inputs/responses. It has taken me quite a while - far longer than what it would have, if I had done this when much younger - but I think I've more or less got the hang of it. And here's a result:

This is a comparison of the estimates of merger fraction for "clean" QC objects, with 0.02 < z < 0.10 AND Z brighter than -20.0; 999 objects in total. The x-axis is "log mass (binned)", with the four sets of estimates offset by arbitrary amounts (so you can see how they differ), as in my last plot in this thread (0.02<z<0.10 AND Z<-20.0 ("clean")). The four sets of estimates - merger fraction and associated error bars - are:
- "jules": the method jules used, upthread
- "Poisson": estimated mean (merger fraction) - f - the same as for "jules"; error bars are SQRT(f*(1-f)/N), where N is the number of object in each bin
- "Wilson": Wilson score interval method, with z = 0.9945 (i.e. "1 sigma"); I'll explain this in more detail later
- "Bayes": Bayesian estimates, using the prior Beta(0.5, 0.5), with 'error bars' set at confidence level 68% (i.e. "1 sigma"); I'm not 100% sure I've applied this approach correctly, but I'll explain what I did, in some detail, later.
For the first five bins, all the results are similar (as I expected), so similar in fact that it wouldn't matter which approach was used (as long as it was consistent!).
For the last bin, however, the results are very different! 😮 As expected, the first two methods ("jules" and "Poisson") give the same result. Also as I expected, the last two methods ("Wilson" and "Bayes") give similar, but not identical, results.
Why are the two sets so different? And which is better, more robust (and why)? I'll discuss what I think in a later post.
To close, the data for the last bin: N=4, f=0 (four QC objects, none of which have t09_a03 vote fractions ≤ 0.500 ("Is the galaxy currently merging or is there any sign of tidal debris?" "Neither")).
UPDATE: Yesterday I posted a plot which contained some
errorsmistakes; I've just replaced it (noerrorsmistakes this time, I hope!)Posted
-
by
JeanTate
in response to JeanTate's comment.
"Wilson": Wilson score interval method, with z = 0.9945 (i.e. "1 sigma"); I'll explain this in more detail later
Health warning first: I understand this stuff only lightly ... while I've read a fair bit on it (see the links in the How to derive physically real error bars, for fractions near 0 and 1? thread), and even followed some of the derivations (!), I don't fully grasp all the concepts and how to apply them. So there may well be mistakes in my explanations; hopefully, however, none in the results from my application of the methods.
The "Wilson" colored squares: each of these is what I think are best described as "the center of the Wilson interval" (another term - "Wilson center adjusted probability" - is less helpful, I think).
Its formula is pretty straight-forward: (f+z2/(2N))/(1+z2/N), where f is the observed (merger) fraction, and N is the number of objects (in a bin).
And 'z'? Not to be confused with redshift! Here are two descriptions of it: "the critical value of the standard Normal distribution at a given error level (e.g., 0.05)", and "z is the (1-1/2α) percentile of a standard normal distribution, α is the error percentile [...]. For example, for a 95% confidence level the error α is 5%, so (1-1/2α) = 0.975 and z = 1.96." Yes, I do understand that ... but putting it into my own words would surely produce an inaccurate statement. In any case, for practical purposes, I've used a 68% confidence level (CL), so z is 0.9945. Why a 68% CL? In my many brushes with statistics, it's questions like these which I find hardest to answer. Why? Because it seems to me to be so ... arbitrary! 😦 Anyway, error bars are very often given as "1 sigma", and for a normal (Gaussian) distribution, (mean±1σ) is ~68% of the area under the curve, so ...
How about the "Wilson" error bars then?
They're the "Wilson adjusted standard deviation", multiplied by z. The formula for this adjusted standard deviation is:
SQRT(f*(1-f)/N+z2/(4N2))/(1+z2/N)It's important to keep in mind that the "center of the Wilson interval" is NOT f, the (observed) merger fraction! Here's the thing: the distribution of 'errors' (actually uncertainty) is not symmetrical around f*; what calculating the Wilson score interval, for a particular observation f, gives you is an interval corresponding to a CL ... f is always in that interval, but never at its center*. In fact, if f = 0 (or 1), it is always at the lower (upper) end of the interval.
However, instead of trying to plot asymmetric error bars, I've plotted symmetric ones, around the centers of the Wilson intervals.
Final note: Where N is "small", a slightly modified version of the Wilson score interval should be used, a "continuity-corrected version of Wilson’s interval" as it is called. I have not done this.
*except if f=0.5
Posted
-
by
JeanTate
in response to JeanTate's comment.
"Bayes": Bayesian estimates, using the prior Beta(0.5, 0.5), with 'error bars' set at confidence level 68% (i.e. "1 sigma"); I'm not 100% sure I've applied this approach correctly, but I'll explain what I did, in some detail, later.
The three other sets of estimates are 'frequentist', this one is 'Bayesian'. Here is not the place for me to try to explain how these differ; suffice it to say that they involve radically different approaches to statistics (so some say), even though the results should - almost always, if calculations using each approach are done correctly - give essentially the same results.
mlpeck briefly explains why the approach I used is good, in several posts in the How to derive physically real error bars, for fractions near 0 and 1? thread; I'm not going to try to repeat these in my own words (see caveat in my last post). Just one general note: I use "confidence levels", a frequentist term, rather than the Bayesian "credible intervals".
Rather than try to describe what I did in general terms, here's the working for the first bin:
- the data: N=140, 19 of these QC objects have t09_a03 vote fractions ≤ 0.500 ("Is the galaxy currently merging or is there any sign of tidal debris?" "Neither"), giving an f of 0.1357 (to four sig figures)
- with a prior of Beta(0.5,0.5), the "posterior probability" is Beta(19.5,121.5)
- for the "Bayes" colored squares I chose the mean, which is 19.5/141 for Beta(19.5,121.5), 0.1383 (see notes below)
- the 68%CL I chose is that between 0.16 and 0.84; plugging the numbers into Open Office's Calc function BETAINV* gives me 0.1095 and 0.1670, respectively
- unlike for the "Wilson" error bars, I plotted the upper (+) and lower (-) bounds separately; I did not try to work out any symmetrical error bars.
Curiously - to me! I'm sure this is sooo basic to mlpeck - choosing which value to plot, for the colored square, seems pretty arbitrary. For example, BETAINV(0.5,19.5,121.5) is 0.1366, and the 'center' of BETAINV(0.16,19.5,121.5) and BETAINV(0.84,19.5,121.5) is 0.1383 ... but the center of the 95%CL (i.e. midpoint of BETAINV(0.025,19.5,121.5) and BETAINV(0.975,19.5,121.5)) is 0.1431! The differences, for this bin, are essentially trivial; for the last bin - with N=4 and f=0 - they are anything but!^
Anyway, that's what I did. Is there a better way?
*I do not know if Excel - or any other widely used spreadsheet - has this function in its vanilla version; it's fairly straight-forward to use BETA to get these values, but if your spreadsheet has BETA it surely will also have BETAINV.
^Just in case it's not clear: the 'error bars' are the interval [BETAINV(0.16,19.5,121.5), BETAINV(0.84,19.5,121.5)]; the 'colored square value' is not any part of the calculation of this intervalPosted
-
by
JeanTate
in response to JeanTate's comment.
Why are the two sets so different? And which is better, more robust (and why)? I'll discuss what I think in a later post.
To repeat: for fractions well away from 0 or 1 (except possibly if N is "small"), it doesn't seem to make much difference which method is used*.
The "Poisson" method produces not unrealistic error bars, at 0 and 1; they are in [0, 1] (unlike the "jules" method, for f=1). However, is it reasonable for all f=0 (1) observations to have 100% certainty, no matter how small N is (clearly N=0 is not data, for our purposes)? I don't think so.
Crudely, if it is OK to consider an observed f=0.100 (say) as having a non-zero uncertainty ('error bars'), of it having a 68%CL of [0.091,0.109] for example (I'm making this up), then an observed f=0.000 should also be considered to have non-zero uncertainty. Of course, such a confidence interval must be in [0, 1], and may include 0. So for this reason alone the "Wilson" and "Bayes" approaches are better than the other two, because they both give non-zero uncertainties, and CLs always within [0, 1].
Are they both robust? A question for a statistician to answer, but my (admittedly minimal) reading of the literature says 'yes'.
Which to prefer? As it's possible to calculate both, easily, without special tools or packages, the choice doesn't come down to practicality. I guess it's then whether you prefer frequentist or Bayesian, right?
Comments?
*OK, one big difference: the "jules" method is clearly inferior for all f > 0.5, as can be seen by simply re-defining f as 1-f ... the error bars should be the same (around f), but they are not
Posted
-
by
JeanTate
in response to JeanTate's comment.
Next: calculate more realistic error bars, re-do with bins of ~equal numbers of objects per bin, examine different vote fraction thresholds, look into ...

The 'error bars' are "Bayes" 68%CLs, per my last post.
The log_mass bins are (almost*) equal in number; "clean" means excluding objects with the ppo flag, but including the 27 QS ones with values of -1 for LOG_MASS (i.e. I used the values in the log_mass_mlp field).
The three vote fraction thresholds - for the t09_a03 vote fraction ("Is the galaxy currently merging or is there any sign of tidal debris?" "Neither") - are:
- 0.5': ≤ 0.500, the same as in the above plots
- 0.6: < 0.400
- 0.7: < 0.300
The merger fractions are similar - but not different, in a statistically significant sense? - for the first three mass bins, but differ (in a statistically significant way?) for the last three bins. For all three vote fraction thresholds. The difference in the highest mass bin is particularly striking. As expected, stricter cuts (tighter thresholds) produce less noisy-looking plots.
I would have liked to have produced plots with 'tramlines' - per Figure A2 from Melvin+ 2014 (copied below) - but do not seem to be able to do so, using Open Office Calc. 😦

*N for the six bins are:
QS 180 181 180 181 181 180 (1083 in total)
QC 189 188 189 188 189 188 (1131 in total)
Posted
-
by
JeanTate
in response to JeanTate's comment.
The log_mass bins are (almost*) equal in number; ...
If the QS and QC objects were matched perfectly, in log_mass, this would be OK; however, they're not, so while the bins may have almost equal numbers in them, they have different log_mass ranges!
So I kept the QS bins, and changed the QC ones slightly, so that the bin ranges are the same as the QS ones*. Here is the revised set of plots:

*Upper bounds for each log_mass bin (four decimals after 10.), and N for the six bins, are:
lm 0260 1920 3390 4642 6820  N/A
QS  180  181  180  181  181  180 (1083 in total)
QC  189  169  215  185  205  168 (1131 in total)
Posted
-
by
JeanTate
in response to JeanTate's comment.
Next: ... look into whether the obvious trends in these plots are different for different redshifts (i.e. repeat a modified version of jules' 'by redshift' plots)
There are two such 'by redshift' plots by jules, one with z < 0.08, and one with z < 0.05. They are the bottom two here (I'm copying the image from the first post of the last page, page 8):
I split the 1083 QS and 1131 QC objects into three redshift bins, so that there are equal QS numbers in each, and the ranges for each are the same for QS and QC objects*. Error bars, 'clean cuts', and '0.6' vote fraction threshold are the same as in my earlier post^.


*Upper bounds for each redshift bin (four decimals after 0.0), and N for the three bins, are:
z  6636 8291 9999
QS  361  361  361 (1083 in total)
QC  364  392  375 (1131 in total)
^The 'error bars' are "Bayes" 68%CLs; "clean" means excluding objects with the ppo flag, but including the 27 QS ones with values of -1 for LOG_MASS (replacing -1 with the values in the log_mass_mlp field); t09_a03 vote fraction ("Is the galaxy currently merging or is there any sign of tidal debris?" "Neither") < 0.4000
Posted