Merger fractions in subset2 (QS)
-
 by
JeanTate
by
JeanTate
Here are some preliminary analyses of how the 'merger fraction' varies with redshift, absolute z-band magnitude, and log_mass, in the quench sample (QS), subset 2*.
First, how three different kinds of 'merger fraction' vary with vote fraction:

The blue - "soa" - line is a kind of noise floor: only ~32% of the 1149 objects have zero votes for "Star or artifact" as the answer to the first question. This rises to ~58% for the bin (>0% to 10%), drops to 9% for (>10% to 20%), with <10% (10) of the objects having a 'soa' vote fraction >20%.
The orange line is the fraction of answers "Merging" + "Both" to question 09; the green diamonds "Tidal debris" + "Both", and the brown line the sum of "Merging", "Tidal debris", and "Both". I call this last parameter "merger fraction". ~7% of the 1149 QS subsample_2 objects are CLEAN mergers, using the 'vote fraction >= 80% = CLEAN' criterion of GZ1.
In the rest of this post I examine how the merger fraction varies
(see important note below!)with redshift, absmag_z, and log_mass. I use three different vote fraction thresholds: >= 60% (blue diamonds), >= 40% (orange diamonds), and >= 20% (green diamonds). I have not attempted to estimate 'errors'.
As we found in some earlier analyses, there seems to be a change at a redshift of ~0.08.
(see important note below!)
The uptick in merger fraction, for the brightest z-band bin, is dramatic, particularly for objects selected with the strictest criterion.
(see important note below!)
Post-quenched galaxies with estimated stellar masses > ~10^10.5 sols have higher merger fractions than less massive ones, and the fraction seems to rise with stellar mass.
(see important note below!)Caveat: question 09 is not asked if the answer to question 00 is soa. All the merger fractions above have the total number of votes for question 09 as the denominator, not the total number of votes for the object.
*absolute z-band magnitude brighter than -20, AND 0.02 < z < 0.10
IMPORTANT NOTE (Thu 20th Feb): there's an error in the 'merger fraction' plots; the y-axes values are wrong by a factor of ~2. I'll be replacing them with the correct plots later today.All the faulty plots have now been replaced (ETA, stardate Thu 20 Feb, 14:42)Posted
-
by
JeanTate
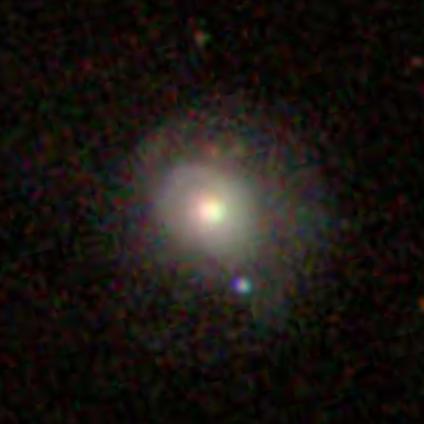
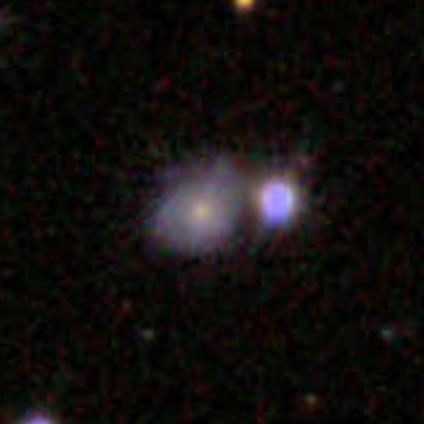
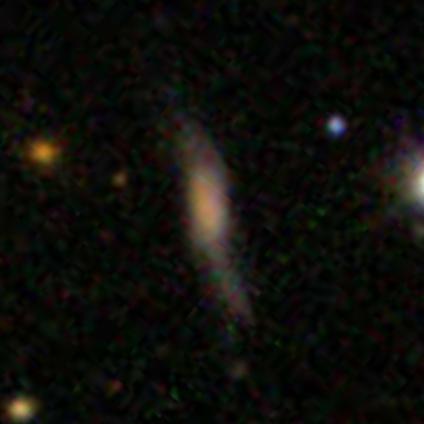
I often find it helpful to look at representative images, to get a feel for what the plots show. Everything in this post is from QS subsample2.
Start with soa.
Zero votes for soa ( AGS00000zv ), 10% ( AGS00001jg
), 20% ( AGS000006c ), and 30% ( AGS00000jt ), respectively; the first three are chosen at random, the last is the only object with a soa vote fraction of 30%.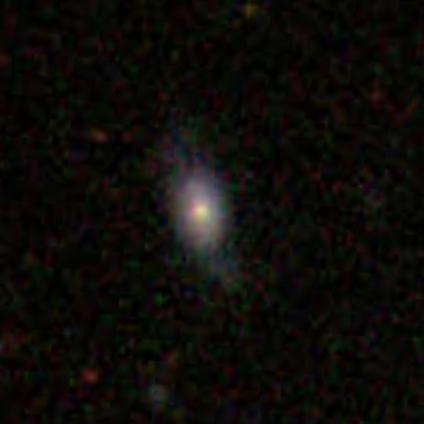
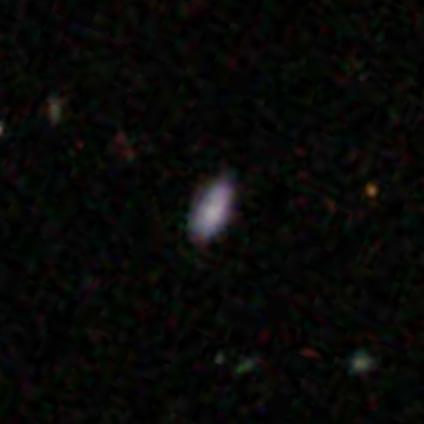
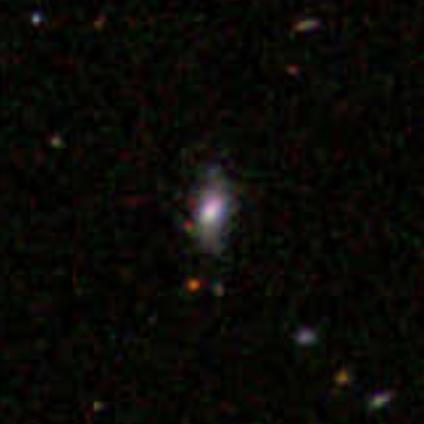
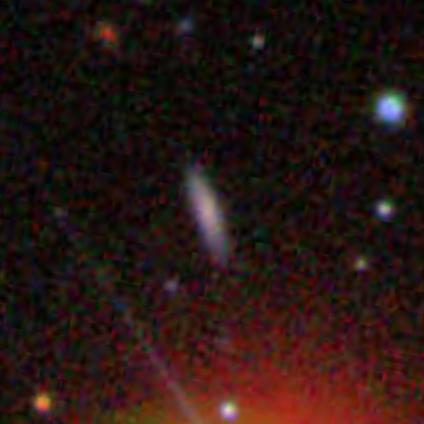
The merger fractions for these four are, respectively: 40% (all 'tidal debris'), 0%, 31% (all 'tidal debris'), and 7% (1 vote for 'tidal debris').
Posted
-
 by
mlpeck
by
mlpeck
I don't understand the first graph in the top post. What is the x axis?
Posted
-
by
JeanTate
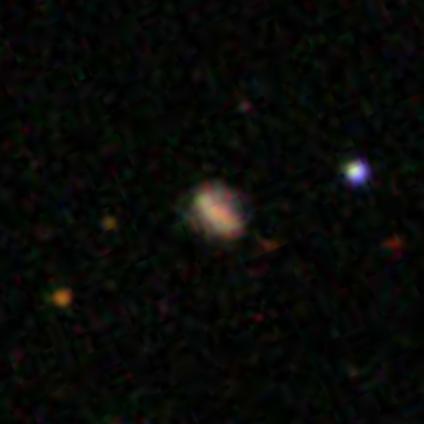
The mean redshift, for QS subsample2, is 0.072. Here are three objects with z ~0.072, chosen at random to be in each of the three 'merger fraction' selections, together with the (redshift, z_absmag, log_mass, merger fraction) for each, respectively.
AGS00001tj (0.072284, -23.1886, 11.1213, 30% (merging 2/20, tidal debris 4/20)):
AGS00000nr (0.0720815, -21.1924, 10.1959, 53% (merging 1/19, tidal debris 9/19)):
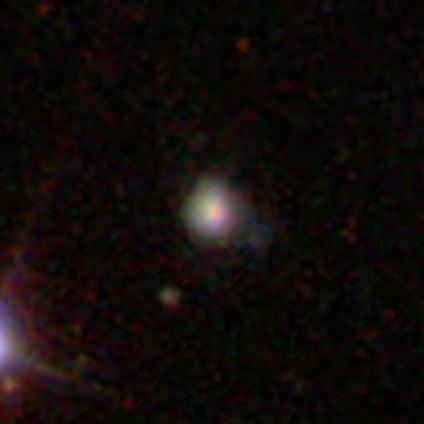
AGS000028a (0.0716779, -21.0217, 10.5314, 95% (merging 16/20, tidal debris 1/20, both 2/10)):
Posted
-
by
JeanTate
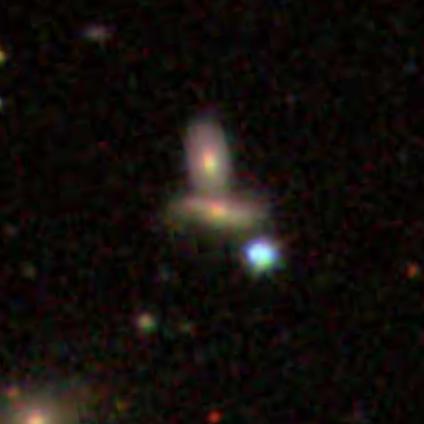
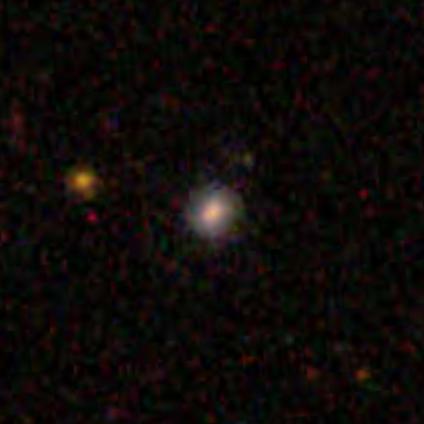
The mean z_absmag, for QS subsample2, is -21.22. Here are three objects with z_absmag ~-21.22, chosen at random to be in each of the three 'merger fraction' selections, together with the (redshift, z_absmag, log_mass, merger fraction) for each, respectively.
AGS00000z5 (0.0762529, -21.2032, 10.3988, 32% (tidal debris 6/19)):
AGS00001xi (0.0711765, -21.2424, 10.1296, 53% (merging 5/19, tidal debris 3/19, both 2/19)):
AGS00001v1 (0.0852629, -21.2167, 10.3963, 60% (merging 6/20, tidal debris 6/20)):
Posted
-
by
JeanTate
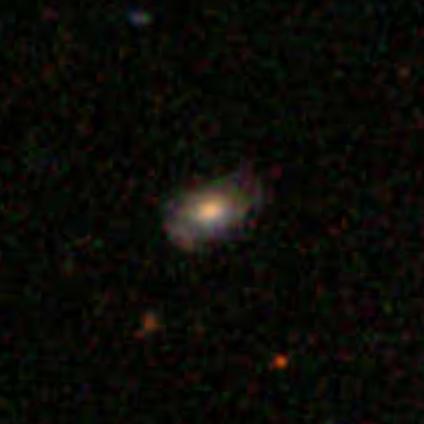
The mean log_mass, for QS subsample2, is 10.34. Here are three objects with log_mass ~10.34, chosen at random to be in each of the three 'merger fraction' selections, together with the (redshift, z_absmag, log_mass, merger fraction) for each, respectively.
AGS000027p (0.0858857, -21.1494, 10.3403, 21% (merging 2/19, tidal debris 2/19)):
AGS00000pb (0.0601728, -20.7764, 10.3341, 50% (merging 3/20, tidal debris 7/20)):
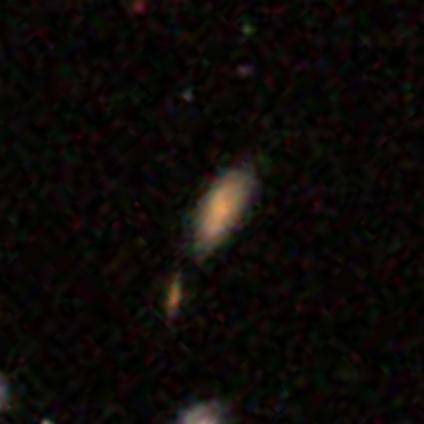
AGS00002aq (0.0592729, -20.8861, 10.3271, 80% (merging 1/20, tidal debris 10/20, both 5/20)):
Posted
-
by
JeanTate
in response to mlpeck's comment.
Vote fraction, for the particular parameter (they're actually bins).
Take the four bins at x=0.4*. This bin is objects whose (parameter) vote fractions are >30% to 40%:
- there are no objects with a soa fraction in this range
- 2% (22/1149**) of objects have "Merging"+"Both" classifications in this range
- 7% (86/1149**) of objects have "Tidal debris"+"Both" classifications in this range
- 8% (93/1149**) of objects have "Merging"+"Tidal debris"+"Both" classifications in this range
*it's actually 0.401
**because those who classified an object as soa were not asked "Is the galaxy currently merging or is there any sign of tidal debris?", these fractions are perhaps not the best to use; however, the purpose of this plot is simply to provide a sensibility check on the vote fraction cuts to be used in the later plots (20% is clearly too low, 60% may be too high/conservative, that sort of thing).Posted
-
by
JeanTate
What do we write up, for the merger fractions result?
The log_mass relationship doesn't seem as clean or as clear as the absmag_z one; however, there is a clear correlation between log_mass and absmag_z (I'll post a plot later today). Stellar mass may be a more fundamental physical attribute than absolute luminosity (whether in one band or generally), but if the relationship with merger fraction is much tighter with the latter?
Posted
-
by
mlpeck
in response to JeanTate's comment.
60% may be too high/conservative
Darg et al. (2010) decided that a weighted merger fraction vote > 0.6 was a "robust" indicator of actual mergers. This was based on GZ1. I wonder if there's a way to replicate their results. Keep in mind that their final selection of mergers was done by visual inspection by credentialed astronomers.
Posted
-
by
JeanTate
in response to mlpeck's comment.
For bars, Masters+ 2012 and Melvin+ 2014 both use >=0.5, and the latter also examines, in an Appendix, how different thresholds - from 0.3 to 0.7 - affect the results (they don't, other than in the obvious way).
Simply by eyeballing the above plots, I think you'd agree that the results are qualitatively the same, whether a 0.2, 0.4, or 0.6 threshold is used. But it's worth my while to dig a bit deeper, just to see what - quantitatively - the differences are (other than the obvious ones).
As I understand it, the result which jules first posted has to do with differences in merger fraction: by log_mass within QS, and between QS and QC. In one respect, does it matter which threshold we use, if the results we're reporting are relative (and are consistent, no matter which threshold)?
Posted
-
by
JeanTate
in response to JeanTate's comment.
there is a clear correlation between log_mass and absmag_z (I'll post a plot later today).
Yep (the blue line is a simple linear trend line):

Curiously, the marked uptick in the merger fraction-z_absmag plot above is at ~-22 ... which is also more or less where the log_mass-absmag_z relationship seems to flatten ... (more later).
Posted
-
by
JeanTate
in response to JeanTate's comment.
Here are the corresponding plots for QC, using all 1196 objects which meet the 'subset2' selection criteria*:

The classification profile - especially the 'noise floor' - is the same, qualitatively at least.


(more later; I'll edit this post)Qualitatively at least, the merger fraction distributions - by redshift, z-band absolute magnitude, and log_mass - do seem different from those of the QS objects. But that's really all that can be said, I think: there are no 'error bar' estimates, the QC objects are not the 1149 matched/paired sample, etc. And in any case, 'potentially problematic sources'** should be identified first; after that, we can decide what to do about them ... and only then does it make sense - to me, at least - to start (actually resume) doing quantitative analyses.
Oh, and I really should do something about the last two plots too ...*0.02 < z < 0.10 AND z-band absolute mag (per Kyle Willett's determination?) brighter than -20.0
**see Laura's post - the 5th one in that thread - in particularPosted