Objects - Galaxies? - indistinguishable from point sources
-
 by
JeanTate
by
JeanTate
Background
In Bamford et al. (2009), which describes how the classification bias was identified and quantified, for the original Galaxy Zoo project, there is a size cut-off: Petro_R50 ~1" ("size greater than twice the angular resolution"). In Willett et al. (2013), which describes something similar for the GZ2 project, one of the selection criteria is a size one, "a size limit of petroR90_r>3 arcsec (petroR90_r is the radius containing 90% of the r-band Petrosian aperture flux)."
In DR9 there are five parameters (one per band) which provide estimates of the probability that an object has a radial intensity profile consistent with that of the PSF (point source function) at that position in the field, probPSF_x (where x is u, g, r, i, or z).
The JPG images we got to classify in the Quench project are produced from the data in just three bands, g, r, and i.
The downloadable Quench project data, the data you can analyze using Tools, includes a field Petro_R50, which is the radius of the object; more exactly, the radius containing 50% of the r-band Petrosian aperture flux. A fair approximation is that an object with a Petro_R50 of ~0.7" or smaller would likely be indistinguishable from a star (a point source). Why? Because the mean r-band seeing during the SDSS runs which produced the data we ended up using was ~1.4", which is a FWHM (full width, half-maximum) measure.
What I would like to do, in this thread, is examine the QS and QC objects which are "small"; specifically, to:
- see how they were classified (what 'the consensus morphology' of each is)
- compare their probPSF_x (x=g, r, i) values
- discuss how likely it is that they are not galaxies
First, the data.
Posted
-
by
JeanTate
QS data
There are 177 QS objects with Petro_R50 ("R50") values < 1.0". In bins of 0.1":
- < 0.6": 2
- > 0.6" to < 0.7": 8
- > 0.7" to < 0.8": 23
- > 0.8" to < 0.9": 57
- > 0.9" to < 1.0": 87
Only three are classified as "Star or artifact" ( AGS000005o, R50=0.84", AGS00001uo, R50=0.85", and AGS00002ak, R50=0.95"); 14 as "Features or disk", and 160 as "Smooth".
The probPSF_x (x=g, r, i) and Petro_R90 ("R90") for the ten smallest - all with R50 < 0.7" - are as follows (R50, R90, probPSF_g, _r, _i):
 AGS00000mt (0.58, 0.98, 1, 0, 0)
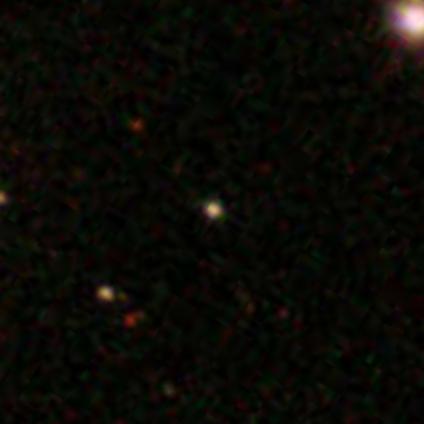 AGS00001z3 (0.58, 1.3, 1, 1, 1)
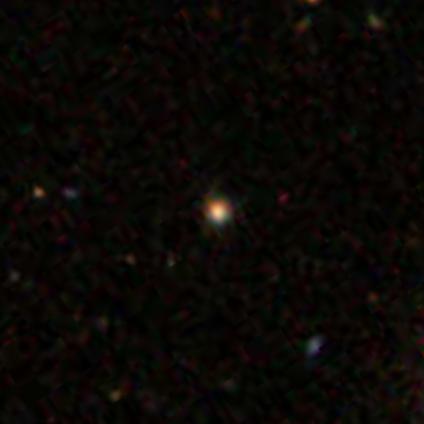 AGS00001lz (0.62, 1.5, 0, 0, 0)
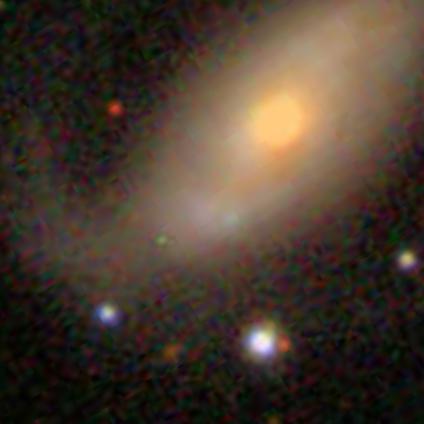 AGS000021r (0.63, 0.91, 1, 1, 1)
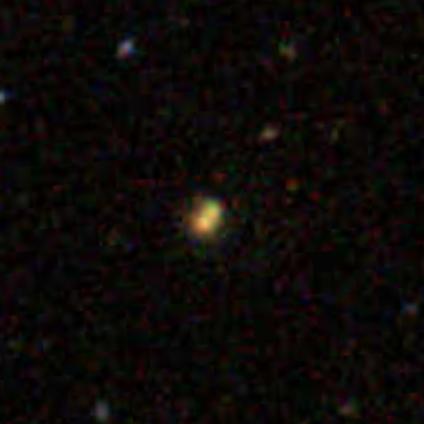 AGS00001eg (0.66, 2.15, 0, 0, 0)
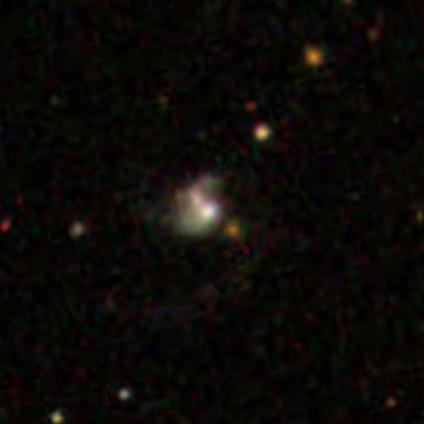 AGS00001fy (0.66, 2.0, 0, 0, 0)
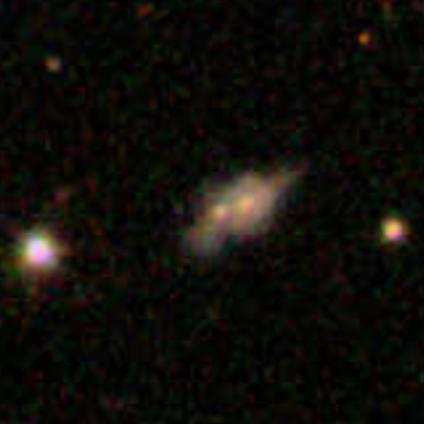 AGS00000wq (0.68, 6.9, 0, 0, 0)
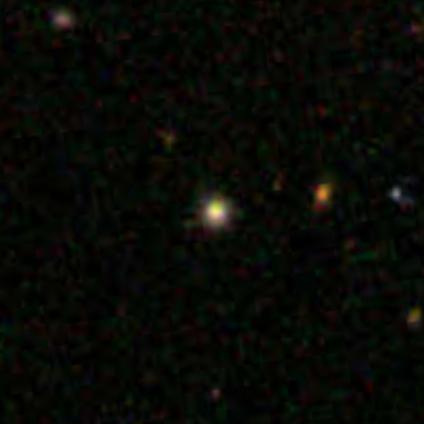 AGS000028i (0.68, 1.7, 0, 0, 0)
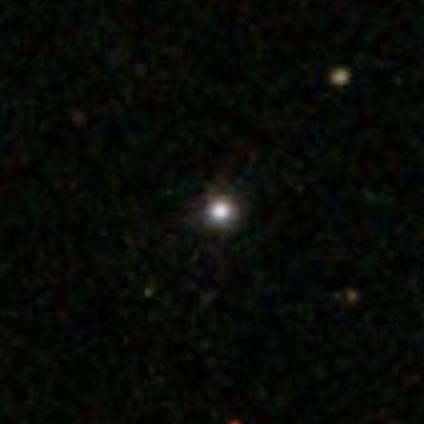 AGS00001bh (0.70, 2.2, 0, 0, 0)
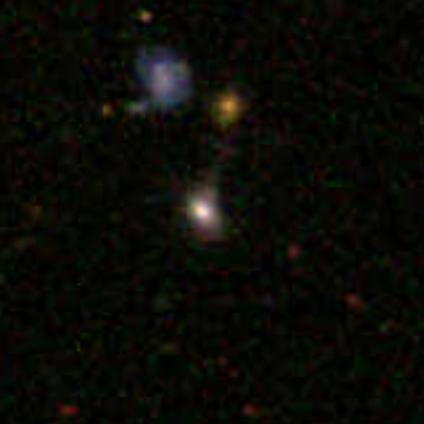 AGS00001hn (0.70, 1.9, 0, 0, 0)
And the three 'Star/artifact' objects:
 AGS000005o (0.84, 1.7, 0, 0, 0)
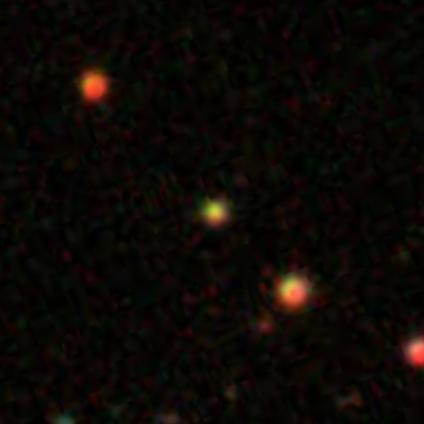 AGS00001uo (0.85, 2.0, 1, 1, 0)
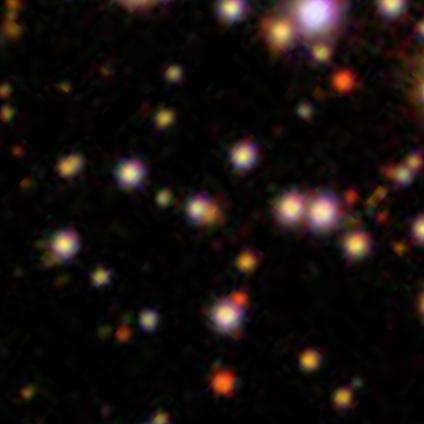 AGS00002ak (0.95, 2.3, 1, 0, 0)
Posted
-
by
JeanTate
QC data
There are 37 QC objects with Petro_R50 ("R50") values < 1.0". In bins of 0.1":
- < 0.6": 1
- > 0.6" to < 0.7": 4
- > 0.7" to < 0.8": 5
- > 0.8" to < 0.9": 9
- > 0.9" to < 1.0": 18
Only three are classified as "Star or artifact" ( AGS00002x2, R50=0.62", AGS00003fj, R50=0.82", and AGS00003ag, R50=0.89"); six as "Features or disk", and 28 as "Smooth".
The probPSF_x (x=g, r, i) and Petro_R90 ("R90") for the ten smallest - all with R50 < 0.8" - are as follows (R50, R90, probPSF_g, _r, _i):
 AGS00002ds (0.56, 1.2, 1, 1, 1)
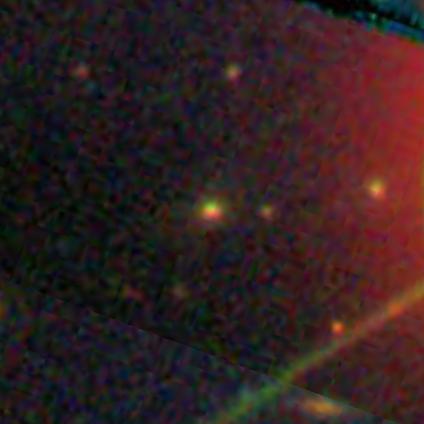 AGS00002x2 (0.62, 1.6, 0, 0, 0) - "Star/artifact"
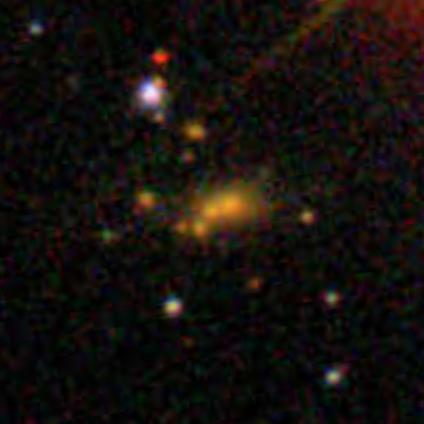 AGS00002n6 (0.65, 1.2, 1, 0, 0)
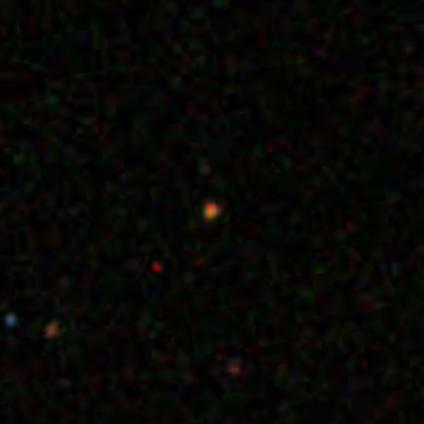 AGS0000462 (0.65, 1.5, 0, 1, 1)
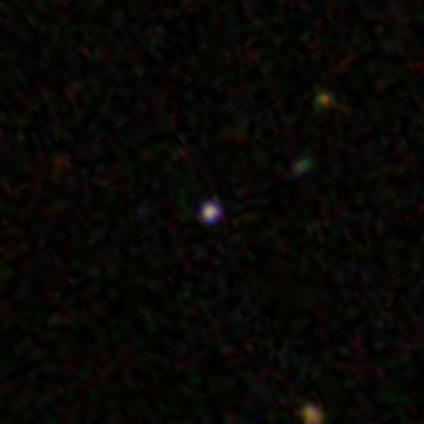 AGS00003jv (0.67, 1.4, 1, 1, 1)
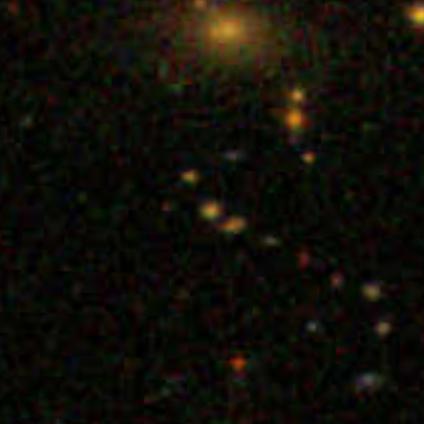 AGS00004fz (0.71, 1.4, 0, 0, 0)
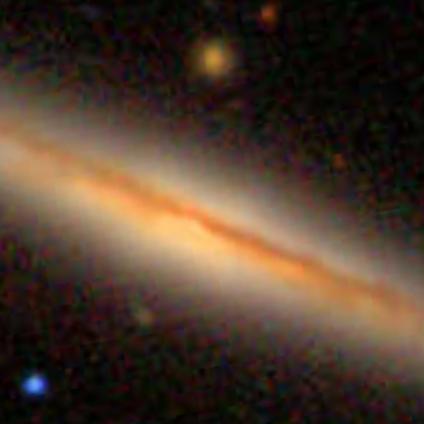 AGS00004ig (0.73, 40.4, 0, 0, 0)
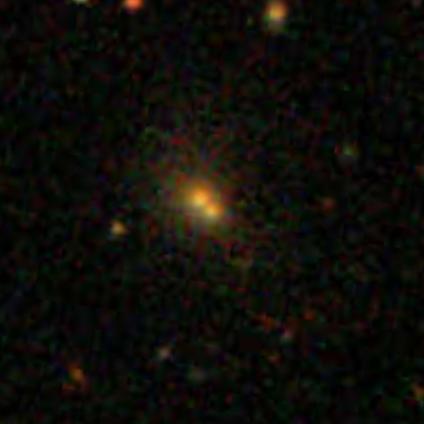 AGS00004ac (0.74, 7.2, 0, 0, 0)
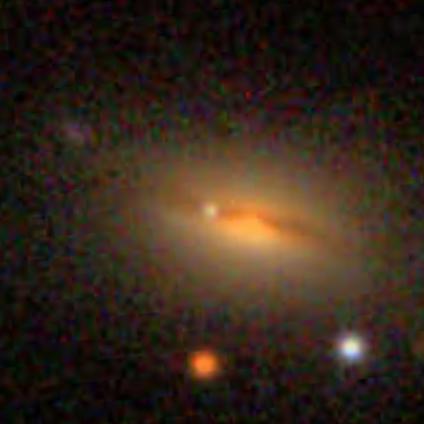 AGS0000445 (0.76, 30.0, 0, 0, 0)
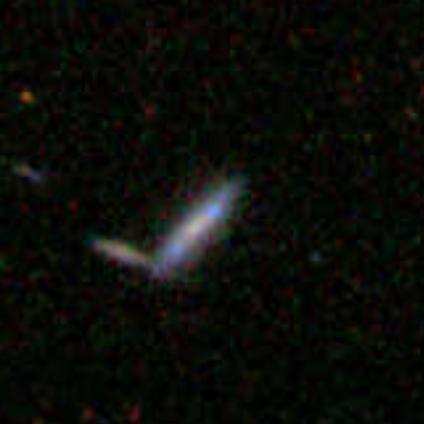 AGS00002ud (0.77, 6.3, 0, 0, 0)
And the two other 'Star/artifact' objects:
 AGS00003fj (0.82, 4.6, 0, 0, 0)
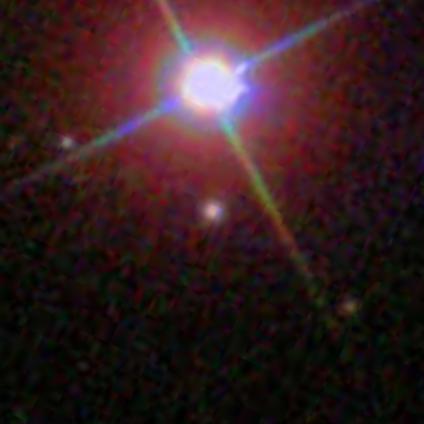 AGS00003ag (0.89, 1.9, 0, 0, 0)
Posted
-
by
JeanTate
A quick check on the other objects with R50 <~1", to note those which are obviously - often wildly - wrong.
QS
 AGS00000ji (0.82, 5.35, 0, 0, 0)
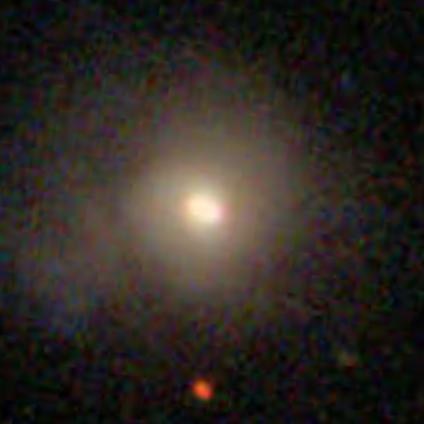 AGS00001se (0.85, 15.2, 0, 0, 0) - fg star?1
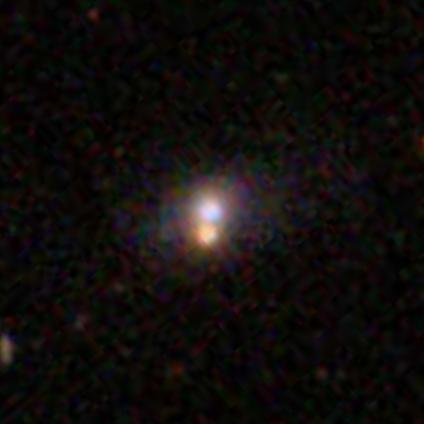 AGS00000y2 (0.97, 2.77, 0, 0, 0)
QC
 AGS0000352 (0.84, 22.9, 0, 0, 0)
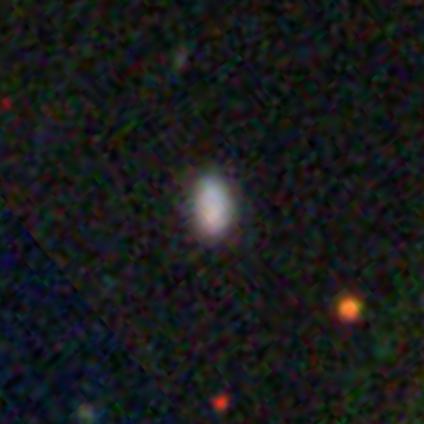 AGS00004bm (0.85, 4.9, 0, 0, 0)
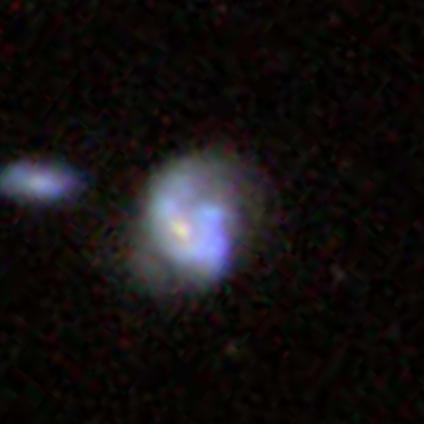 AGS000048a (0.92, 10.7, 0, 0, 0)
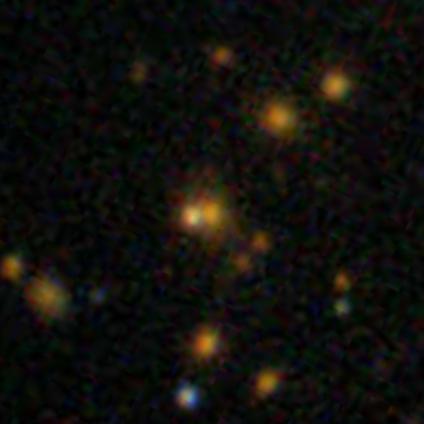 AGS0000470 (0.92, 6.92, 0, 0, 0)
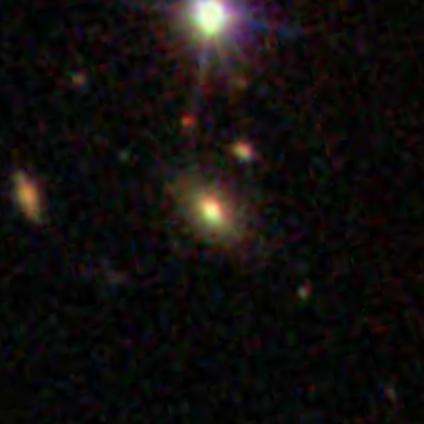 AGS00003hq (0.96, 2.7, 0, 0, 0)
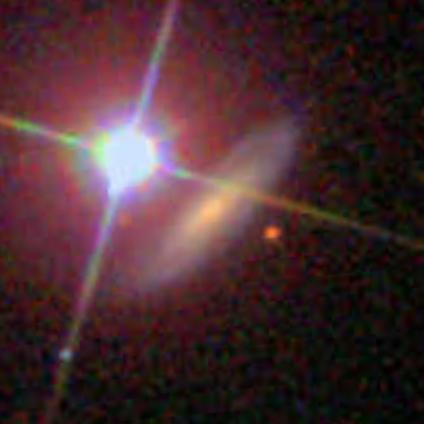 AGS000031r (1.0, 11.5, 0, 0, 0)
1 No. I wrote this up as a post in the GZ forum, here. The DR10 image is much clearer than the DR8 one:
Posted
-
by
JeanTate
Some seem, well, odd.
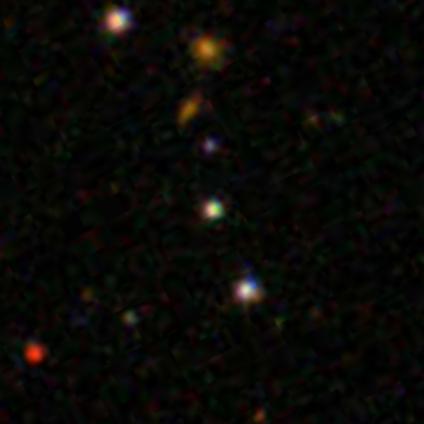
Consider this triple, all QS, with almost identical values of R50:
 AGS00001ng (0.981")
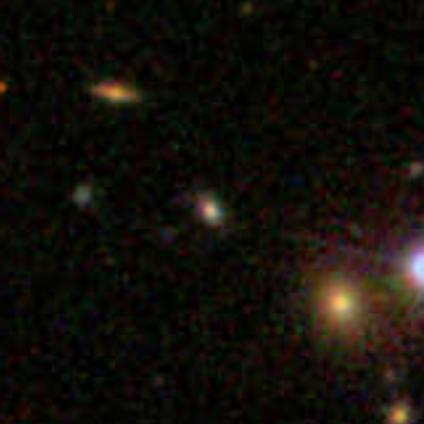 AGS000018b (0.982")
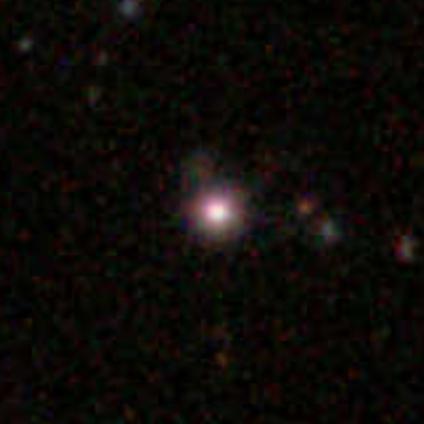 AGS00001ho (0.984")
And this pair from QC:
 AGS00003x7 (0.943")
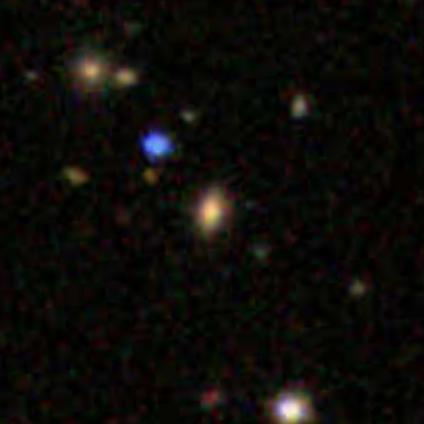 AGS000038g (0.943")
Posted
-
by
JeanTate
Test of the visualization technique described here, using the 100 smallest QC objects (as measured by Petro_R50). The images are DR10, and the scale is 0.4:
By eye, I'd say the numbers of catastrophic failures, in each row of ten, are (from top, smallest, to bottom):
3, 2, 1, 1, 2, 0, 1, 1, 0, 1.
Here are the same 100, with a scale of 0.2:
UPDATE: I added the AGS IDs as the 'alt text' in the image URLs of the first set of 100. This should make it much easier to identify any particular image/object, so making it easier to do follow-ups on apparent outliers/anomalies.
Posted
-
by
JeanTate
A quick cross-check: my detailed look at the ten smallest QC objects, brief eyeball of the other 27 (<~1"), and the 100 60x60 pix images:
- AGS00002n6 and AGS00004ac (both in the first 10, both co/m1) not among the 3/10 in the first row of 'the 100'
- the other three outliers in this first ten were identified in 'the 100'
- AGS0000352, AGS00004bm, AGS000048a, and AGS000031r are the 2/10, 1/10, and 1/10 in rows 2, 3, and 4 (respectively); all are noted in both the 'brief eyeball' and in 'the 100'
- AGS0000470 and AGS00003hq are among 'the 27', and noted in the brief eyeball, but not in the 100.
The five others I noted in the 100 are (AGS ID, R50, R90):
 AGS00002y7 (1.02, 36.6)
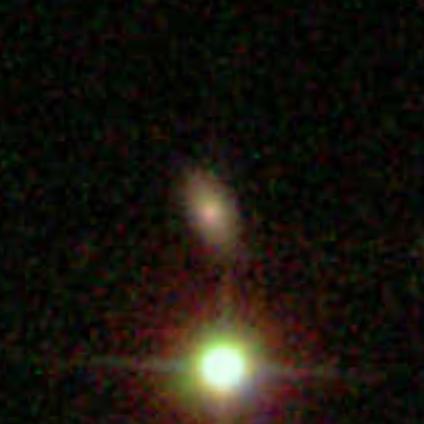 AGS000034b (1.03, 5.1)
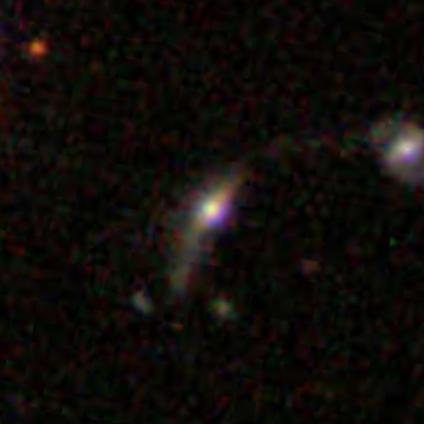 AGS00002qg (1.07, 3.0)
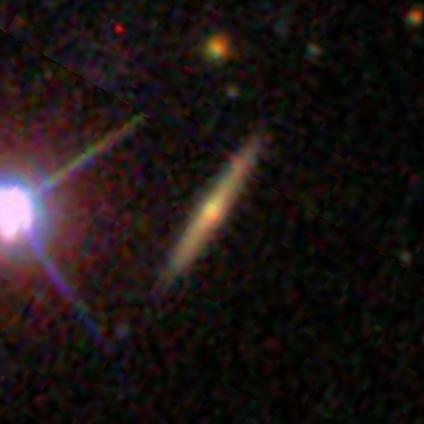 AGS000045m (1.1, 8.6)
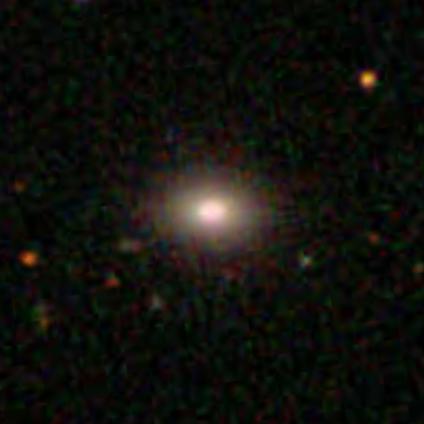 AGS00002nh (1.14, 3.46)
One other, which I was of two minds on:
 AGS00003k3 (1.09, 4.6)
1 complex overlap/merger
Posted
-
by
JeanTate
The smallest 100 QS objects, per DR10; scale=0.3:
Posted
-
by
JeanTate
Big galaxies with small cores
Consider the QC object AGS00003hq:
It has an R50 value of 0.96 and an R90 one of 2.7. Somewhat simplified, this means that, in the r-band, it is 2.81 times bigger at the 9th decile than at the 5th ... or that the ratio of R50 to R90 is 0.356. This last number is called the 'inverse concentration ratio' (in the r-band), and it is a parameter used to determine if a galaxy is more likely to be a spiral (disk) or an elliptical (no disk)1.
0.385 is, as the value of the r-band inverse concentration ratio, a good first choice, to distinguish disk galaxies from ellipticals. So AGS00003hq is, very likely, an elliptical. But how low can values of this ratio go? For a truly on-its-own galaxy - and not a merger or overlap, or a clump or region of a larger galaxy - what is a reasonable minimum for this parameter? If we have such a minimum, it would be possible to separate apparently anomalous objects (i.e. on-their-own galaxies which have R50 values that seem too low) from (very likely) anomalous ones.
I haven't checked the relevant literature (again), but in my Huds research, I have not found any galaxy2 with an inverse concentration ratio less than 0.21. So a working value, for the minimum, might be 0.20.
How do the galaxies2 I've noted as having anomalous values of R50, in this thread, fare, when measured using the inverse concentration ratio ruler?
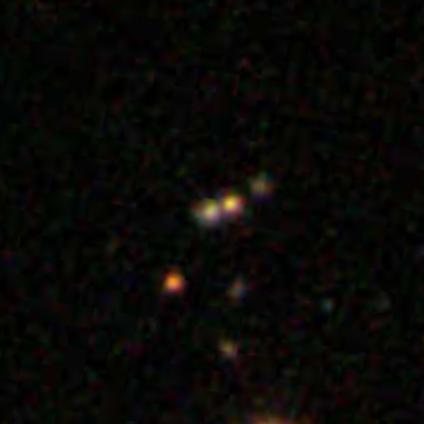
Well, here's one that remains anomalous AGS00003fj (R50 is 0.82, R90 4.6; the ratio is 0.18):
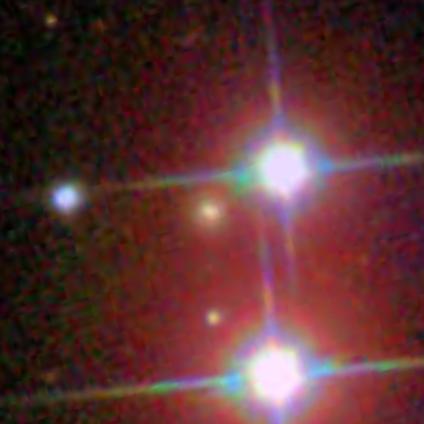
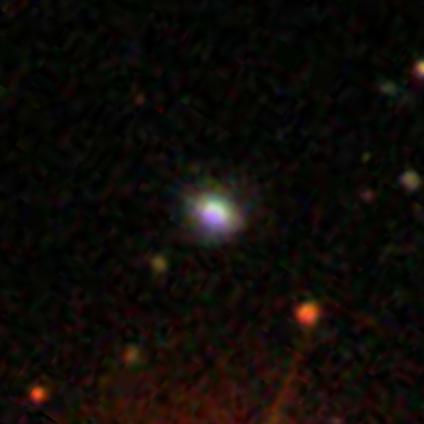
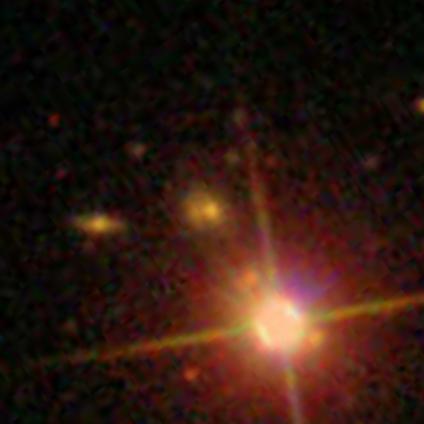
And another, AGS000031r (1.0, 11.5; 0.09):
Which confirms what you probably would have guessed anyway ... being close to a really bright star can mess with the photometric pipeline's
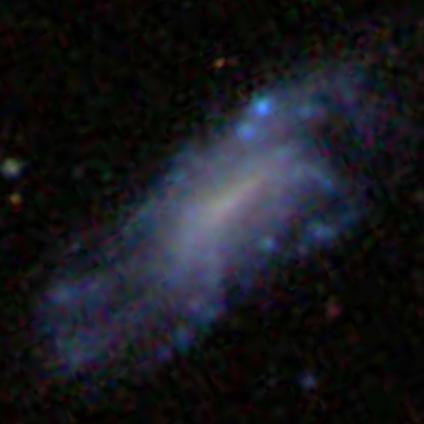
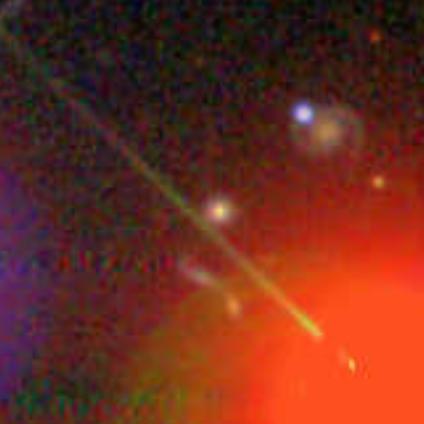
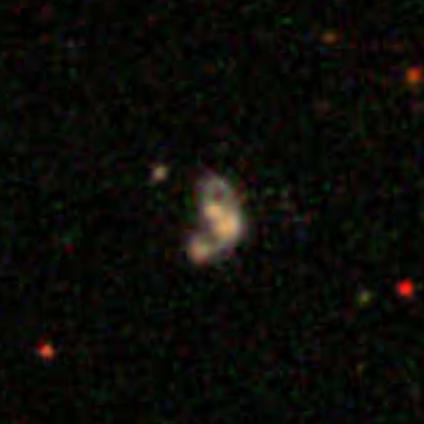
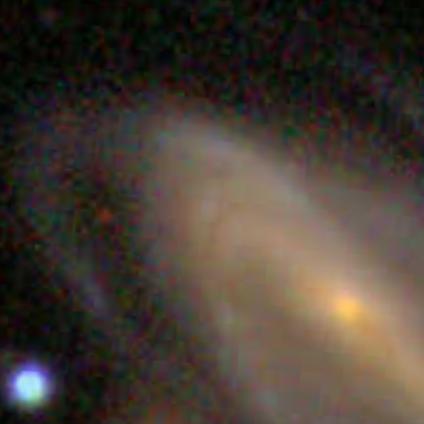
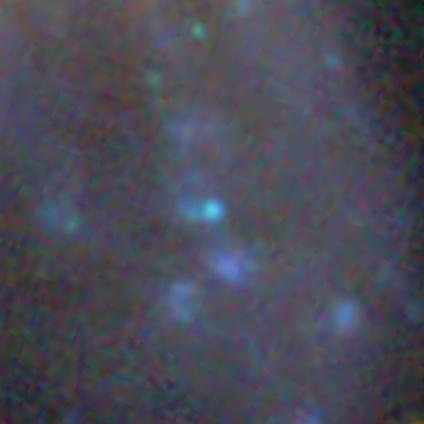
headconclusions.But what about this one AGS000045m (1.1, 8.6; 0.13)?
Is there some sort of overlap (the odd feature crossing the disk near its top tip), or is that an artifact? Is the proximity to the bright star enough to mess up the estimate of R90? Do highly elongated Eos - especially if they have a tiny (or non-existent) bulge - have really small inverse concentration ratios?
1 I used this parameter to help me decide if my Huds (huge distant spiral) candidates were, in fact, spirals. See Discovery of Four Giant, Distant Spirals
2 on-it-own, not merging, not an overlap, and where R50 and R90 refer to the whole galaxy (not a clump, or region, within a galaxy)
Posted