Duplicates: independent test of the robustness of our classifications.
-
 by
JeanTate
In the Duplicates thread I posted details of the 43 pairs I'd found; in Duplicates - summary, a summary.
Some time after Kyle announced the update to the morphological data in the QS and QC catalogs (Data update in Tools), I downloaded the two.
At the time, during Phase 1, no zooite had any idea that there were duplicates. And it seems that no one on the Science Team did either. So comparison of the two sets of morphological classifications should be very revealing; specifically, they provide an independent test of the robustness of our classification. Albeit a small one; 43 pairs is but a tiny, tiny subset of 3002 pairs!
In this thread I plan to look, in considerable detail, at the similarities and differences in the two sets of independent classifications. There are 11 columns/fields in the classification part of the two catalogs; I will examine each in turn. These fields are, in the order they appear in the catalogs:
- smooth
- how_round
- disk_edge
- central_bulge
- center_bar
- spiral_arms
- arm_tightness
- central_bulge_prominence
- clumps
- merging
- symmetrical
Posted
-
 by
JeanTate
smooth
The classification question is "Is the galaxy simply smooth and rounded, with no sign of a disk?". There are three choices, Smooth, Features or disk, and Star or artifact. Every one of the 86 unique AGS IDs has one of these three 'answers'. The breakdown is:
- Smooth: 67
- Features or disk: 18
- Star or artifact: 1
Among the 43 pairs, there are five (12%) with discordant classifications; four Smooth/Features or disk, and one Smooth/Star or artifact.
The four are (just one AGS ID is necessary): AGS00003tu, AGS00002p1, AGS00002xx, and AGS00002j1:
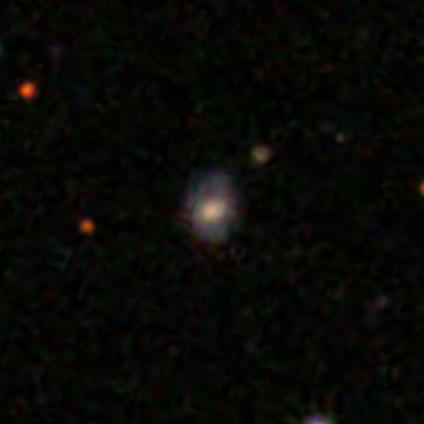
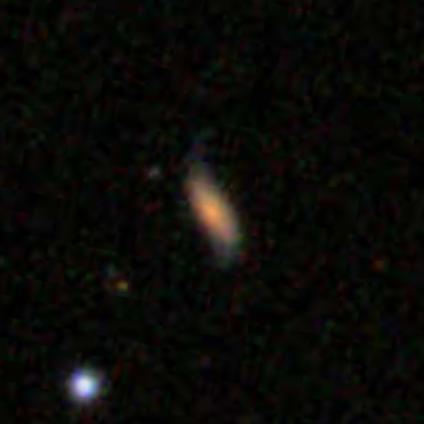
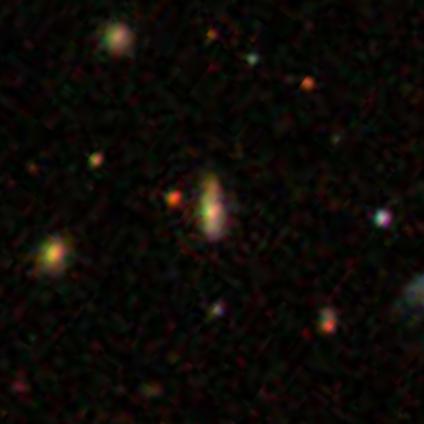
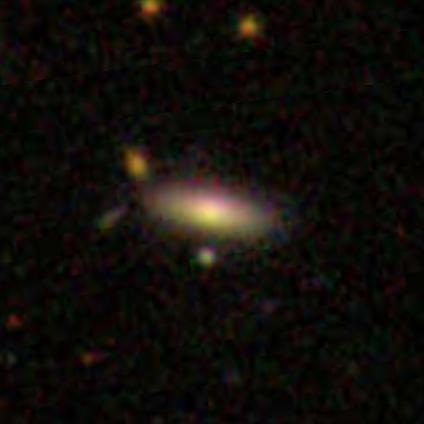
The one is AGS00003ep:
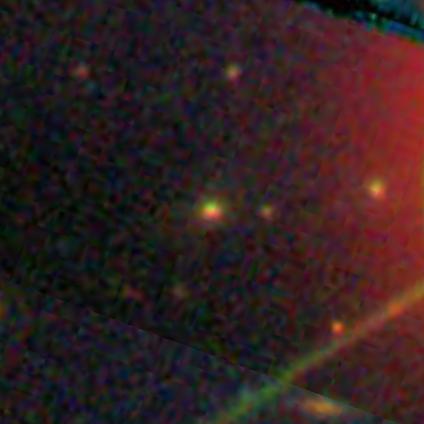
Posted
-
 by
JeanTate
how_round
This field is populated, in the two catalogs, only if the answer to the question "Is the galaxy simply smooth and rounded, with no sign of a disk?" is "Smooth". There are 31 pairs (of 38 'in agreement' pairs; 82%) for which both answers are "Smooth" (and five in which just one of the two answers is "Smooth").
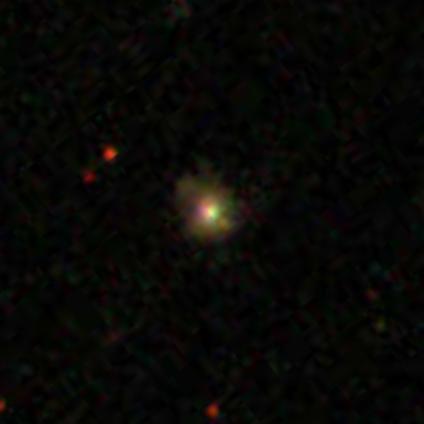
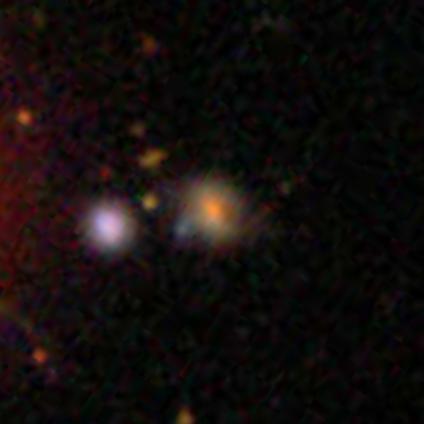
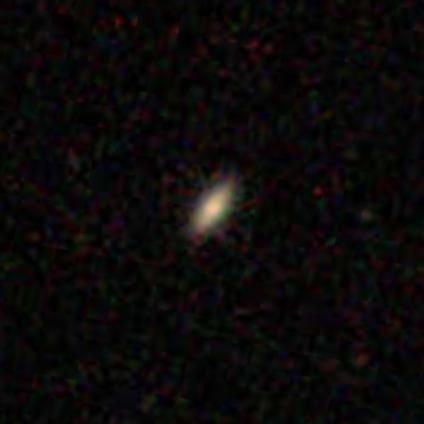
The question asked at the step is "How rounded is it?" The three choices here are Completely round, In between, and Cigar shaped. In three pairs (of 31, 10%) the "How round?" answers are different. For the other 28 pairs, 13 (46%) are "Completely round", 14 (50%) "In between" and just one (4%) "Cigar shaped".
Two of the discordant pairs are Completely round/In between:
And AGS00003b8:
The remaining discordant pair is In between/Cigar shaped, AGS00004lx:
Of the five top-level discrepant classifications, the one Smooth/Star or artifact is Completely round:

Two are In between:


And two are Cigar shaped:


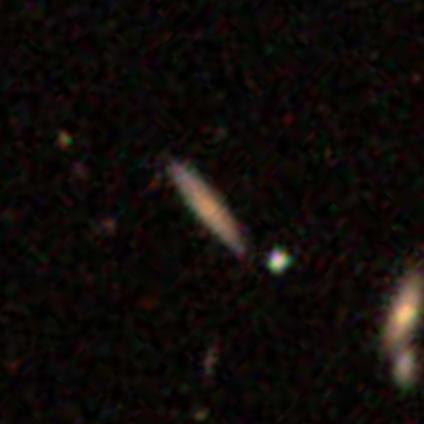
An interesting comparison is with AGS000009s, the one object among the duplicates classified as Smooth/Cigar shaped in both of the pair:
Posted
-
 by
JeanTate
disk_edge
This is one - of seven - fields that is populated only if the answer to the top-level question ("Is the galaxy simply smooth and rounded, with no sign of a disk?") is "Features or disk". There are seven pairs (of 38 'in agreement' pairs, 18%) for which both answers are "Features or disk" (and four in which just one of the two answers is "Features or disk").
The question asked at this step is "Could this be a disk viewed edge on?", and the two choices here are "Yes" and "No". In all seven pairs (for which both answers are "Features or disk"), the answers are both "Yes" (two, 29%) or both "No" (five, 71%); there are no discordant responses.
Of the four (in which just one of the two answers is "Features or disk"), two are "Yes", and two "No".
The Yeses:


And the two Noes:


Posted
-
 by
JeanTate
central_bulge
This is one - of seven - fields that is populated only if the answer to the top-level question ("Is the galaxy simply smooth and rounded, with no sign of a disk?") is "Features or disk". Further, it is asked only if the answer to the next level question - "Could this be a disk viewed edge on?" - is "Yes". As there are only six objects with this answer (two pairs and two 'singles'), the classification robustness test for this answer is weak.
The actual question asked is "Does the galaxy have a bulge at its center?". Both pairs are discordant, one "Yes" and one "No".
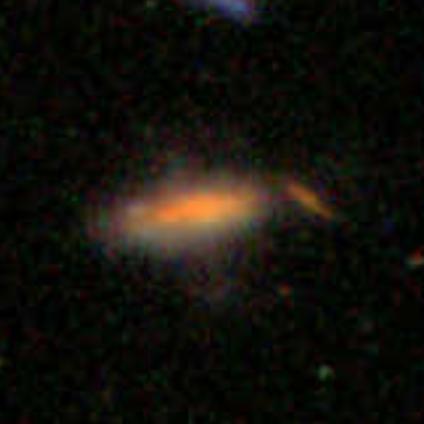
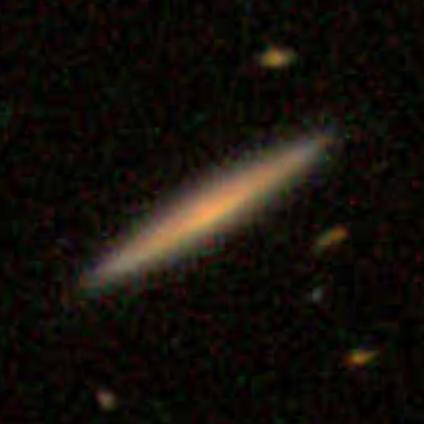
For both the 'singles', the answer is "Yes":


Posted
-
 by
JeanTate
center_bar
This is one - of seven - fields that is populated only if the answer to the top-level question ("Is the galaxy simply smooth and rounded, with no sign of a disk?") is "Features or disk". Further, it is asked only if the answer to the next level question - "Could this be a disk viewed edge on?" - is "No".
The question asked is "Is there any sign of a bar feature through the center of the galaxy?", and there are just two choices, "Yes", and "No". There are five pairs, and none are discordant: four "No" and one "Yes". There are also two 'singles', both Noes.
Posted
-
 by
JeanTate
spiral_arms
This is one - of seven - fields that is populated only if the answer to the top-level question ("Is the galaxy simply smooth and rounded, with no sign of a disk?") is "Features or disk". Further, it is asked only if the answer to the next level question - "Could this be a disk viewed edge on?" - is "No".
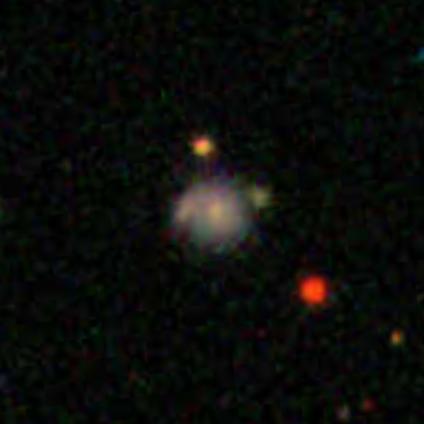
The question asked is "Is there any sign of a spiral arm pattern?", and there are three choices: "Spiral", "No spiral", and "Can't tell". There are five pairs, and two 'singles'. None of the 12 answers is "Can't tell". Just three (of five, 60%) pairs have the same classification, two "Spiral" and one "No spiral"; both singles are "No spiral".
The two discordant Spiral/No spiral pairs are AGS00001k4 and AGS00001k6:
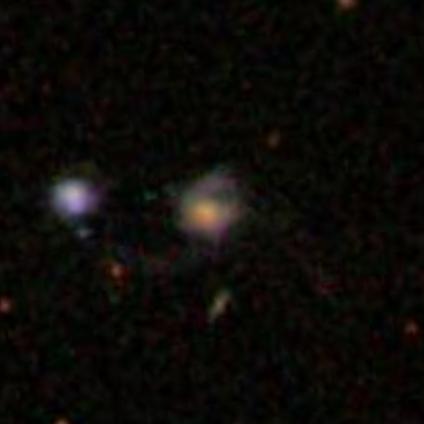
For comparison, the two single 'No spiral's are:


Posted
-
 by
JeanTate
arm_tightness
This is one - of seven - fields that is populated only if the answer to the top-level question ("Is the galaxy simply smooth and rounded, with no sign of a disk?") is "Features or disk". Further, it is asked only if the answer to the next level question - "Could this be a disk viewed edge on?" - is "No" AND if the answer to the next question ("Is there any sign of a spiral arm pattern?") is "Yes".
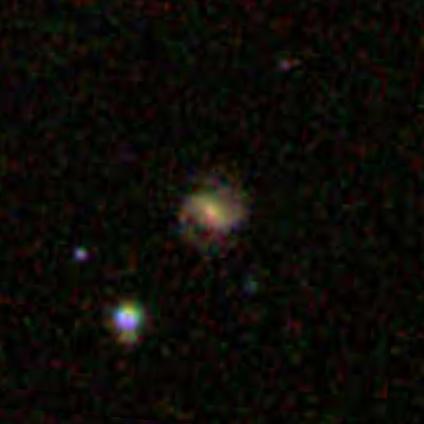
The question asked is "How tightly wound do the spiral arms appear?", and the three choices are "Tight", "Medium", and "Loose". Just six objects got this far in the classification decision tree, two pairs and two 'singles'.
One pair is an 'in agreement' one ("Tight"), and one discordant, Medium/Loose. Here is that discordant one, AGS00003cf:
For comparison, the two singles, both of which are "Tight":


Posted
-
 by
JeanTate
central_bulge_prominence
This is one - of seven - fields that is populated only if the answer to the top-level question ("Is the galaxy simply smooth and rounded, with no sign of a disk?") is "Features or disk". Further, it is asked only if the answer to the next level question - "Could this be a disk viewed edge on?" - is "No".
The question asked is "How prominent is the central bulge, compared with the rest of the galaxy?", and the choices are "No bulge" and "Obvious", and "Dominant". There are five pairs with answers to this question; all are 'in agreement', and for all the answer is "Obvious". There are also two 'singles', one also has the choice "Obvious", the other "No bulge". Here is that last, "No bulge" ('single') galaxy:

Posted
-
 by
JeanTate
clumps
This is one - of seven - fields that is populated only if the answer to the top-level question ("Is the galaxy simply smooth and rounded, with no sign of a disk?") is "Features or disk". Further, it is asked only if the answer to the next level question - "Could this be a disk viewed edge on?" - is "No".
The question asked is "Are there any off-center bright clumps embedded within the galaxy?", and the choices are "No", "1" and "More than 1".
NOTE: the diagram in Kyle's post (here, and blog post, here) is inconsistent with the downloaded data. The diagram indicates that this question is asked even if the answer to "Could this be a disk viewed edge on?" is "Yes"! 😮
There are five pairs - four 'in agreement', all "No" - and two 'singles' (both "No"). The discordant pair is a No/1 one, AGS00001k4:

Posted
-
 by
JeanTate
merging
The question "Is the galaxy merging or is there any sign of tidal debris?" is a classification question asked in every case but one: when the answer to the top-level question is "Star or artifact". Among the 86 duplicates, just one is classed as Star or artifact, so there are 85 answers to this "merging" question, 42 pairs and one 'single'.
While there are four possible answers to this question - "Merging", "Tidal debris", "Both", and "Neither" - only three are found among the 85; "Both" is absent.
36 (of 42, 86%) of the pairs are 'in agreement': 33 (92%) are "Neither", two (6%) are "Tidal debris", and one (3%) is "Merging". The six (of 42, 14%) discordant pairs are of the following types:
- Neither/Tidal debris: four (10%)
- Neither/Merging: one (2%)
- Tidal debris/Merging: one (2%)
Here are the six discordant pairs.
AGS00001k4 (Neither/Tidal debris):

AGS00002p1 (Neither/Tidal debris):

AGS00003b8 (Neither/Tidal debris):

AGS000013g (Neither/Tidal debris):
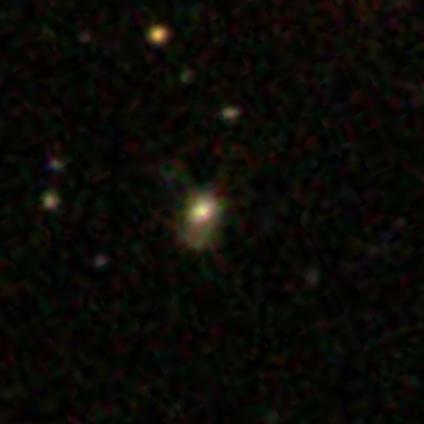
AGS000027k (Neither/Merging):
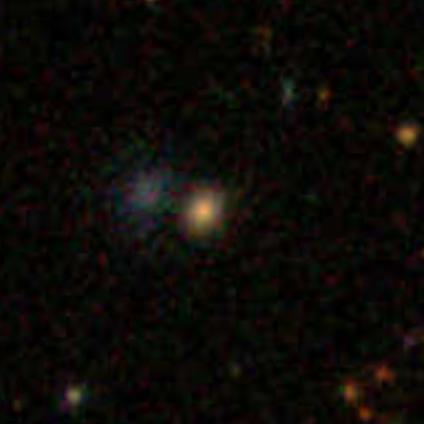
AGS0000080 (Tidal debris/Merging):

For comparison, here are the two 'in agreement' "Tidal debris", and the one "Merging".
AGS00001k6 (Tidal debris):

AGS00002bi (Tidal debris):
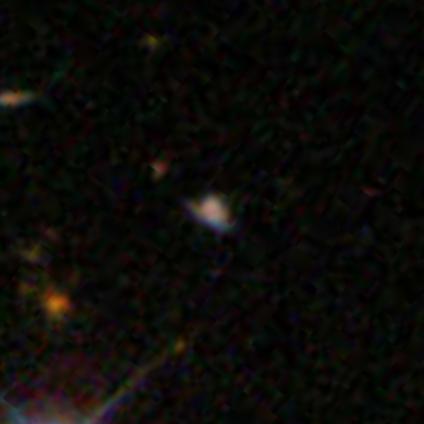
AGS00002i4 (Merging):
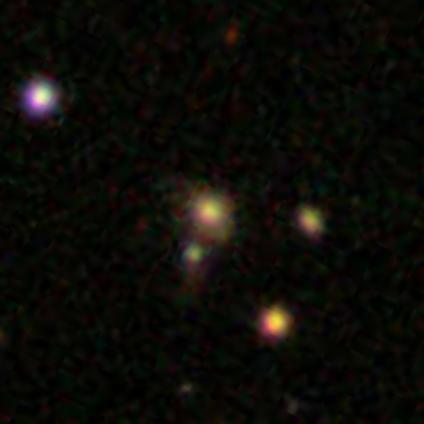
Posted
-
 by
JeanTate
symmetrical
The question "Does the galaxy appear symmetrical?" is a classification question asked in every case but one: when the answer to the top-level question is "Star or artifact". Among the 86 duplicates, just one is classed as Star or artifact, so there are 85 answers to this "symmetrical" question, 42 pairs and one 'single'.
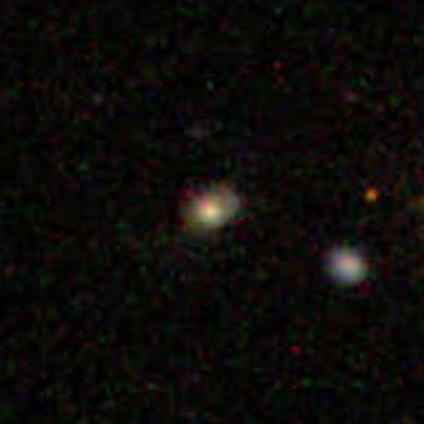
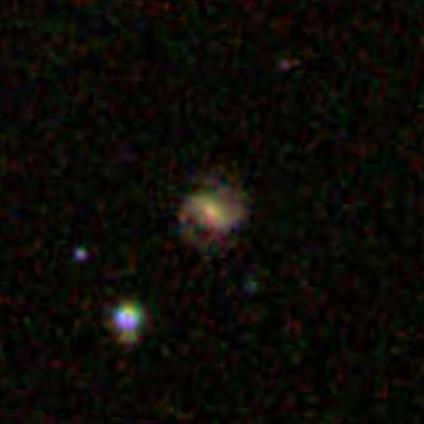
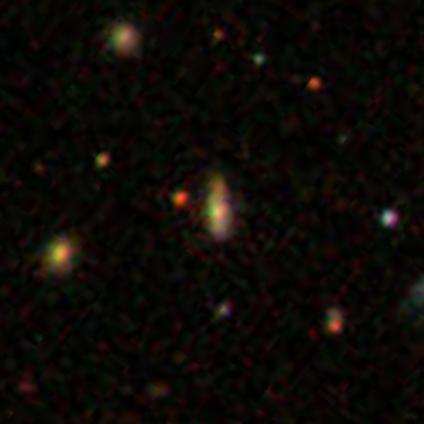
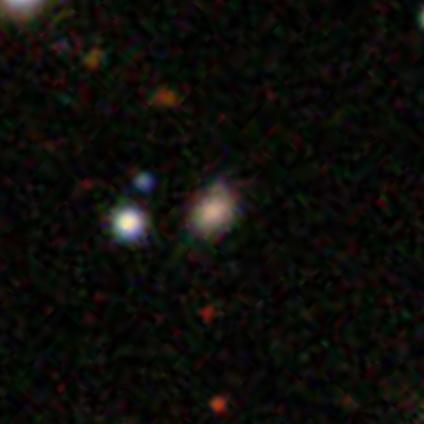
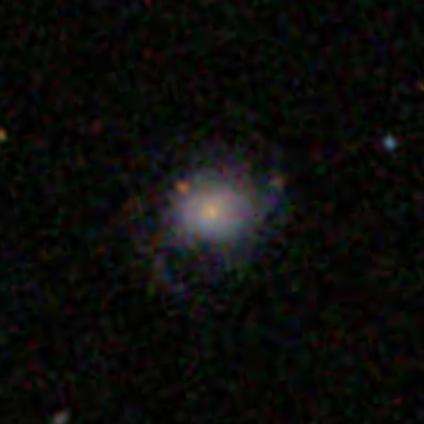
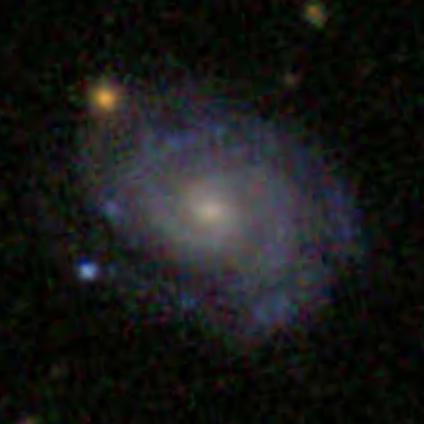
There are two choices, "Yes" and "No". There are 21 'in agreement' "Yes" pairs (of 42, 50%), 12 "No" pairs (29%), and nine discordant ones (21%). The one single is a "Yes".
Here are the nine discordant pairs.
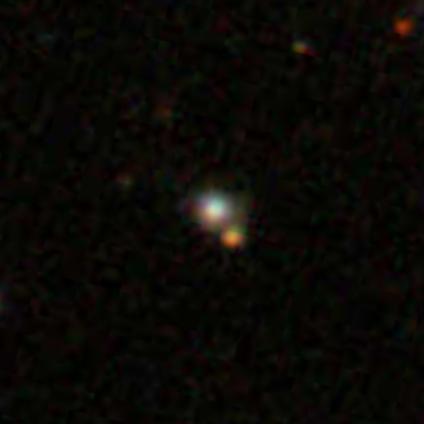
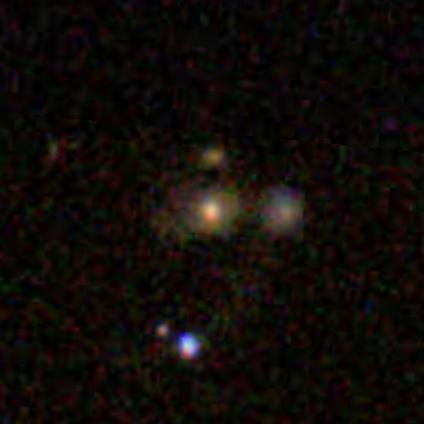

Posted
-
 by
JeanTate
Summary: discordant vs 'in agreement', by question
By the numbers: question, total number of pairs (in bold), number of discordant pairs, percentage discordant/total (in brackets)
Is the galaxy simply smooth and rounded, with no sign of a disk? 43 5 (12%)
How rounded is it? 31 3 (10%)
Could this be a disk viewed edge on? 7 0 (0%)
Does the galaxy have a bulge at its center? 2 2 (100%)
Is there any sign of a bar feature through the center of the galaxy? 5 0 (0%)
Is there any sign of a spiral arm pattern? 5 2 (40%)
How tightly wound do the spiral arms appear? 2 1 (50%)
How prominent is the central bulge, compared with the rest of the galaxy? 5 0 (0%)
Are there any off-center bright clumps embedded within the galaxy? 5 1 (20%)
Is the galaxy merging or is there any sign of tidal debris? 42 6 (14%)
Does the galaxy appear symmetrical? 42 9 (21%)
It seems to me that, in general, the level of disagreement between the pairs is surprisingly high. Ignore the seven questions with fewer than ten pairs; the disagreement among the remaining four questions ranges from 10% to 21%, and averages 14%.
But maybe these 43 objects are themselves outliers, highly unusual within either the QS or QC (or both) catalog(s)? Time to find out.
Posted
-
 by
JeanTate
After removing the QC duplicates (55), and other photometrically-relevant outliers (32 so far; details upon request) - leaving 2915 QC objects - here are the distributions of answers to each question:
Is the galaxy simply smooth and rounded, with no sign of a disk? Smooth 2135 (73%); Features or disk 780 (27%); Star or artifact 0 (0%)
How rounded is it? Completely round 896 (of 2135, 42%); In between 1084 (51%); Cigar shaped 155 (7%)
Could this be a disk viewed edge on? Yes 168 (of 780, 22%); No 612 (78%)
Does the galaxy have a bulge at its center? Yes 146 (of 168, 87%); No 22 (13%)
Is there any sign of a bar feature through the center of the galaxy? 113 Bar (of 612, 18%); No bar 499 (82%)
Is there any sign of a spiral arm pattern? Spiral 367 (of 612, 60%); No spiral 245 (40%); Can't tell 0 (0%)
How tightly wound do the spiral arms appear? Tight 172 (of 367, 47%); Medium 137 (37%); Loose 58 (16%)
How prominent is the central bulge, compared with the rest of the galaxy? No bulge 35 (of 612, 6%); Obvious 536 (88%); Dominant 41 (7%)
Are there any off-center bright clumps embedded within the galaxy? 1 41 (of 612, 7%); More than 1 55 (9%); No 516 (84%)
Is the galaxy merging or is there any sign of tidal debris? Merging 141 (of 2915, 5%); Tidal debris 117 (4%); Both 12 (0.4%); Neither 2645 (91%)
Does the galaxy appear symmetrical? Yes 2305 (of 2915, 79%); No 610 (21%)
Posted
-
 by
JeanTate
After removing the QS duplicates (31), and other photometrically-relevant outliers (25 so far; details upon request) - leaving 2946 QS objects - here are the distributions of answers to each question:
Is the galaxy simply smooth and rounded, with no sign of a disk? Smooth 2211 (75%); Features or disk 733 (25%); Star or artifact 2 (0.1%)
How rounded is it? Completely round 784 (of 2211, 35%); In between 1205 (55%); Cigar shaped 222 (10%)
Could this be a disk viewed edge on? Yes 221 (of 733, 30%); No 512 (70%)
Does the galaxy have a bulge at its center? Yes 185 (of 221, 84%); No 36 (16%)
Is there any sign of a bar feature through the center of the galaxy? 73 Bar (of 512, 14%); No bar 439 (86%)
Is there any sign of a spiral arm pattern? Spiral 242 (of 512, 47%); No spiral 270 (53%); Can't tell 0 (0%)
How tightly wound do the spiral arms appear? Tight 79 (of 242, 33%); Medium 93 (38%); Loose 70 (29%)
How prominent is the central bulge, compared with the rest of the galaxy? No bulge 26 (of 512, 5%); Obvious 392 (77%); Dominant 94 (18%)
Are there any off-center bright clumps embedded within the galaxy? 1 58 (of 512, 11%); More than 1 70 (14%); No 384 (75%)
Is the galaxy merging or is there any sign of tidal debris? Merging 169 (of 2944, 6%); Tidal debris 345 (12%); Both 41 (1.4%); Neither 2389 (81%)
Does the galaxy appear symmetrical? Yes 1954 (of 2944, 66%); No 990 (34%)
Posted
-
 by
jules
moderator
Nice work Jean. On a quick look through there seems to be some differences in classifying the spiral features in QS v QC that are worth a closer look.
Posted
-
 by
JeanTate
in response to jules's comment.
Thanks! 😃
Indeed. I'm already working on this. At some point it would be good for an astronomer who's au fait with the relevant statistical tests to jump in ... I can certainly run standard things like chi-square(d) on a two-way contingency table, but there are (very likely) some subtleties that need to be taken account of.
Posted
-
 by
lpspieler
moderator
Hi Jean,
there seems to be at least one argument speaking against using the differing classification results for the duplicates as measure of the classification reliability:
We just don't know what calculation was used for declaring a galaxy as - say - "smooth". Is a simple majority vote used? In that case the difference between a "smooth" and a "features" classification might be no more than 2 votes out of 10 (or more). Unless we are able to choose subsets of galaxies in QS and QC for which there is a high accordance in the votes then differing classification results might have a questionable significance.
If, however, we have the same galaxy classified by 70% with answer 1 in the first classification run and then by 70% with the inverse answer then this would definitely force us to take a closer look.
@Laura: Can we get the classification percentages?
Posted
-
 by
JeanTate
in response to lpspieler's comment.
These are important considerations, of course.
However, as long the classifications - what we zooites did - were consistent, and the determination of 'consensus morphology' (see Kyle's post, here) was also consistent, we can make comparisons with confidence. Indeed, I think the 'consensus morphology' classifications (once suitable weights have been applied) are what was used to estimate the 'classification bias', in both the first GZ data release (method based on Bamford et al. 2009) and the second (Willett et al. 2013).
Perhaps an example might help. Here are the numbers of objects classified as 'features or disk' (first row) and 'smooth' (second), for QS (first column) and QC (second)1:
       780  733
      2135 2211
The X2 (chi-square(d)) statistic is 2.65, with one degree of freedom (dof), which has an associated probability of 0.104. At this level of analysis, that suggests that QS galaxies are merely somewhat more likely to be spirals (have 'features or disks') than the QC ones.
How about the duplicates? Because there are two datapoints for each object, counting is not straight-forward; let's count each 'in agreement' pair as 1, and each half of a discordant pair as 0.5. The contingency table - comparing QC with duplicates (ignoring the 'star or artifact' classification) - is then:
       733    9
      2211   33.5
which has a X2 of 0.31 (and 1 dof), and an associated probability of 0.58. So, statistically speaking (at least with respect to this particular test), the distribution of classifications for the duplicates is the same as that of QC (and, when you run the numbers, QS too; X2 = 0.67, p=0.41).
There are too few objects - for this test to be meaningful - in at least seven of the 11 questions/classifications; for two questions, there are only three 'counts, one has four counts, three six, and one nine.
1 excluding the overlaps and outliers (as described above), and ignoring the 'star or artifact' classification
Posted
-
 by
JeanTate
in response to lpspieler's comment.
The four questions for which a contingency table X2 test might work, to check robustness of classification using duplicates, are Is the galaxy simply smooth and rounded, with no sign of a disk? ('smooth'), How rounded is it? ('how_round'), Is the galaxy merging or is there any sign of tidal debris? ('merging'), and Does the galaxy appear symmetrical? ('symmetrical').
For the first question, the QS and QC distributions are not really different; no surprise then that the duplicates distribution isn't different either (from either the QS or the QC one).
Here's the same analysis applied to 'symmetrical'; QS in the first column, 'No' the first row:
610 990 2305 1654X2 is
200.1184.51 (1 dof), with p = 0. Yes, QS galaxies are more symmetrical than QC ones.Comparing QS with the duplicates:
610 16.5 2305 26X2 = 8.0, p = 0.0045. Same result; QS galaxies are more symmetrical than the duplicates.
And comparing QC with the duplicates:
       990   16.5
      1654   26
This time X2 =
0.44, p = 0.510.034, p = 0.851. Statistically speaking, no difference; the duplicates and QC galaxies could have been chosen - at random - from the same population.What if we compare the duplicates to the combined QS and QC objects?
1600 16.5 3959 26X2 =
19.3, p = 02.1, p = 0.151.What does this mean? And why is it worthwhile to do such tests? If it turns out that the duplicates are - in their patterns of classification (consensus morphologies) - different from either the QS or QC (or both), then we can't really use what we've found concerning the robustness of the classifications (of the duplicates) to conclude anything much about the robustness of the classifications of the two main catalogs. And - with caution - vice versa.
But first, the two other questions.
1 fixing some silly mistakes in my calculations
Posted
-
 by
JeanTate
Is the galaxy merging or is there any sign of tidal debris? ('merging'). A 4 x 2 contingency table is called for here, as there are four possible answers (classifications). However, for three of the choices, the number of duplicates - the 'count' - is very low, making a test using such a table meaningless. However, combining 'Merging', 'Tidal debris', and 'Both' - to produce a 2 x 2 table - brings the numbers up to barely OK.
The QS and QC catalogs (excluding the overlaps and outliers (as described above)) have different distributions: the QC objects have statistically significantly more signs of merging than the QS ones (X2 = 111, p = 0). However, the duplicates are not that different from either the QS (X2 = 1.8, p = 0.18) or the QC (X2 = 0.35, p = 0.55) ones.
For How rounded is it? there are three choices. In this case, however, just one choice (for the duplicates) is unpopular ('Cigar shaped'). Two sets of calculations then, one which ignores 'Cigar' (and treats this question as having two possible answers), and one which combines this with 'In between'.
Again, The QS and QC catalogs (excluding the overlaps and outliers (as described above)) have different distributions: the QS objects are 'rounder' than the QC ones (X2 = 13.8, p = 0.0002). However, the duplicates are not that different from either the QS (X2 = 0.06, p = 0.81) or the QC (X2 = 0.79, p = 0.37) ones.
Much the same if the 'Cigar' and 'In between' categories are combined: X2 = 19.4, p = 0 (QS and QC are very different), X2 = 0.13, p = 0.72 (QS-duplicates), and X2 = 1.26, p = 0.26 (QC-duplicates).
So the duplicates are not outliers; their classification distributions, for the four questions for which there's enough data to perform a simple contingency table test, are statistically indistinguishable from either the QS objects or the QC ones ... or - for three of the four questions - both.
Is it reasonable, then, to conclude that individual classifications are only good to ~15%? I think so; what do you think?
Another thing to look at: are there other attributes (parameters) - directly relevant to morphology classification - which might be important? Good question! but for another post ...
Posted
-
 by
JeanTate
Of the many fields (parameters, attributes) in the QS and QC catalogs, very few are directly related to the images we, ordinary zooites, saw when we classified them (excluding the classifications themselves, of course!).
The two most obvious - to me anyway - are color and size.
The colors (g-r) and (r-i) are poor substitutes for the rich color experience we had, when classifying. Nevertheless, if the duplicates have colors very different from the majority of either the QS or QC objects (excluding the duplicates themselves, and outliers), the surprisingly high level of variation in classification may have something to do with this color difference. So, how do the colors of the duplicates compare with those of the QS and QC objects?
To make this comparison, just one of the QS-QC duplicates must be chosen (they're the same object, so no need to count any twice). Further, the one QC object in each of the QC-QC duplicates must be chosen carefully, so that it corresponds with the one we got to classify (see Oh dear! for details). Finally, what to do about the QS-QS duplicate? There's no easy answer, so I left both out of the color analysis.

The blue dots in this color-color plot are the QC objects (excluding outliers and duplicates); the orange diamonds the 42 duplicates (anyone know how to create a plot like this using Tools?). Some of the duplicates are at the edge of main cloud, and one - AGS00002v3 - is rather a long way from the main cloud. However, the color distributions seem very similar.

That's the same thing, but with the QS objects (sans outliers and duplicates); note that the axes have different ranges. In this case, AGS00002v3 is even more of an outlier ... but otherwise the color distributions are very similar.
So, what about the other field/attribute/parameter? Next post!
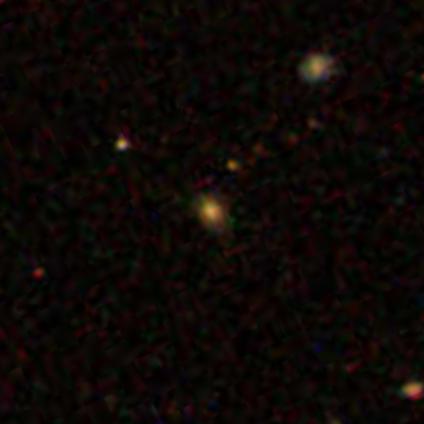
Curious about AGS00002v3? It's a QC-QC duplicate, and its classifications are 'in agreement' (smooth, in between, not merging/no tidal debris, symmetrical), and its redshift is rather high (0.305). Here it is:
Posted
-
 by
JeanTate
Size is the other parameter which is directly related to a morphology classification, and the fields in QS and QC catalogs include Petro_R50 (R50). How to compare the distribution of R50 values for the duplicates with either the QS or QC catalog ones (excluding the duplicates and outliers)? One way is to divide the QS and QC catalogs into quintiles, five groups with (approximately) the same number of objects, ranked by size. Then find out which quintile each of the duplicate objects is in, and see if the distribution is significantly different ... if perfectly the same, there would be 8.4 (=42/5) objects in each quintile.
Perhaps an example might help.
Consider AGS00002bi:

Its R50 is 1.48". The smallest QC quintile goes up to 1.61", so AGS00002bi is in the first QC quintile. For QS, the second quintile ranges from 1.35" to 1.76", so it's in the second QS quintile.
Some difference is expected, because the size distribution of the QS objects is different from that of the QC ones (see Quench: Sample vs Control, what's the same, what's different for details). Here is the actual distribution of the duplicates' sizes; the first row is using the QS quintiles, the second the QC one:
      Quintile  1  2  3  4  5
      vs QS:   14 10  3 10  5
      vs QC:   20  7  5  7  3
A X2 test confirms what you strongly suspect: the duplicates' size distribution is statistically different from that of both the QS (X2 = 9.2, 4 dof; p = 0.057) and the QC one (X2 = 21.3, 4 dof; p = 0.0002); the duplicates are 'over-weight' in smaller objects. Specifically, in the smallest of objects, those in the first quintile. If these are excluded, the duplicates become more alike QS (quartiles of 7, X2 = 5.4, 3 dof; p = 0.14) and QC (even more so; quartiles of 5.5, X2 = 2.0, 3 dof; p = 0.57).
So, are the discordant pairs concentrated in the over-represented group, the smallest of objects? If so, then the rather high level of disagreement in consensus morphology among the duplicates may be due, at least in part, to the difficulty of reaching consensus for small objects.
Sadly, that is not the case. 😦
Of the five disagreements in 'Smooth vs Features or disk' classification1, only one is in the QS (or QC) first quintile (size-wise). And just two (of seven) disagreements in 'How smooth?' are in the QC first quintile (and none in the QS one). And one (of five) of the "Signs of merger?" classifications (both QS and QC). And one (two) - of nine - of the 'Symmetrical?" classifications (one for QS, two for QC).
1 out of 42 pairs; the QS-QS pair is excluded from this analysis
Posted