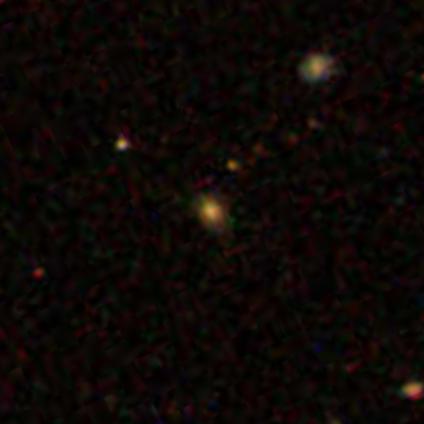
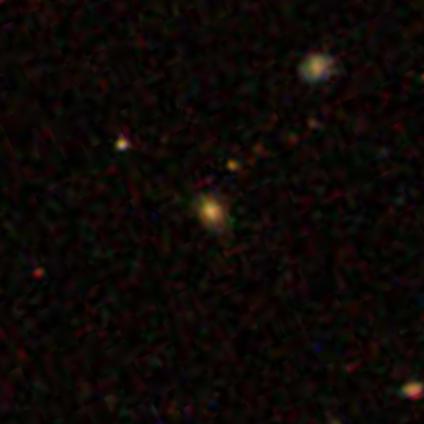
Oh dear!
-
 by
JeanTate


Respectively, AGS00002v3 and AGS00002og. Both are QC objects.
From the QC catalog I downloaded, here are the values for some parameters (in the same order):
- RA: 219.45288, 219.45288
- Log_mass: 11.080174, 11.080174
- Redshift: 0.30540621, 0.30540621
- Petro_R50: 0.960144, 1.09209
- u: 23.9112, 21.256
- r: 19.4832, 18.9544
- SDSS_ID: 588009372832301090, 588298663584596167
Hmm, I wonder what the values for the two objects with these two SDSS_IDs are? Here's what I found (in the same order):
- RA: 154.35103365, 219.45285766
- Redshift: 0.297972, 0.30540621
- Petro_R50: 0.960144, 1.09209
- u: 23.9112, 21.256
- r: 19.4832, 18.9544
So it seems like the first object - DR7 ObjId 588009372832301090 - is quite different from the second (parameter values are different), but that somehow they got mixed up. More importantly, the image we were given to classify (AGS00002v3) does not match DR7 ObjId 58800937283230109, whose parameter values are given correctly in the QC catalog ... except for the redshift1.
What, then, does DR7 ObjId 58800937283230109 look like? This:
An isolated case?
Sadly, no. I have - so far - checked just five of the 13 QC-QC duplicates, and they're all also mismatches like this.
Beyond the duplicates, how many other objects have AGS images which do not match the corresponding entries in the QC (and QS) catalog?
1 It is likely that the Log_mass values are also mixed up/in error; however, we do not know the source of these, so we can't check
Posted
-
 by
JeanTate
in response to JeanTate's comment.
I have now checked all 13, and they're all like this 😦
The good news - if it can be called that - is that, in the QC catalog, these 13 are the only pairs which have the same redshifts (i.e. both objects have values for 'Redshift' which are the same). Ditto Log_mass.
Next: the 29 QS-QC duplicates.
Posted
-
 by
trouille
scientist, moderator, admin
Jean, so good to see this post and that you're following up on these sample issues. I'm in the process of fixing the control sample to account for these duplicates as well as the duplicates to sources within the post-quenched galaxy sample. I'll post this afternoon to give an update on this.
Posted
-
 by
JeanTate
I have some good news: these 13 are the only ones - that I could find - where the AGS image (and some fields in the corresponding QC catalog) are wrong.
The 29 QS-QC duplicates are all OK (see below though): other than very small differences in (RA, Dec), the values in all fields are the same in each pair (two caveats: see below). E.g. the Petro_R50 value in the QS catalog entry is the same as that in the corresponding QC catalog.
Even better news: there are ~250 pairs of objects with identical Log_mass values; nearly all are QS-QS, a few are QS-QC, and there's one QC-QC (excluding Log_mass = -1, and the 43 duplicates). And another ~10 with identical redshift values (some overlap), all but one of which are QS-QS pairs (excluding duplicates). I was concerned that there may be mismatches, like the 13 QS-QC duplicates, so I checked them all. The good news is that they are all unique. Whew! 😃
What is somewhat strange is why there are more than a handful of such cases anyway. I mean, with 6k records, and a fairly limited range of values, you'd expect there to be some pairs with identical values, if they have ~5 significant figures. In the catalogs the number of significant figures for these two fields varies, making random matches less likely. Also, the data from which the Log_mass and redshift values have been derived - i.e. the FITS spectra - are exceedingly unlikely to be the same. So why so many pairs of identical Log_mass values? Why so few triplets (essentially zero)? Why overwhelmingly in the QS catalog?
Here is below (I just discovered the "Horizontal rule"! 😛)
In every one of the 29 QS-QC duplicate objects, there is but one DR7 spectrum. Even when you look at all the close neighbors. Yet in every case the Log_mass and redshift values are different! 😮
Take AGS00000yl (QS)/ AGS00004ho (QC), for example.
The two Log_mass values are 10.8494, and 10.849358, respectively.
And the two redshifts are 0.234206, and 0.23420645, respectively.
Of course, these differences are totally irrelevant in terms of any analysis we might want to do, in Stage 2. But where do they come from? Was the PCA analysis run twice (assuming Log_mass and redshift are outputs of that analysis)?
One other minor mystery: how did it happen that the same object was picked twice? It is not at all uncommon to find "SECONDARY" (photometric) SDSS objects at distances < ~0.003' from the PRIMARY, so you can imagine that, somehow, a secondary object was selected by some automated routine. And in 17 of the 29 there is at least one such secondary (one has four!).
But for 12, there are no secondaries.
Posted
-
 by
JeanTate
in response to trouille's comment.
Thanks.
Could you also post details of how you made the fixes (after they're done, of course!)?
Posted