Estimating the missing stellar masses
-
 by
mlpeck
by
mlpeck
This is partially a repost of one I made in another thread, but I'm going to create a new one and hope it gets noticed here.
There's a fairly substantial body of literature claiming that stellar masses, or equivalently M/L ratios can be predicted with fair accuracy with visual-near IR magnitudes and colors alone. A fairly recent example came from the GAMA collaboration (Taylor et al. 2011: http://arxiv.org/abs/1108.0635). Skip ahead to page 20 for the basic result, which says that a simple linear regression of stellar mass on color and absolute magnitude provides an estimate of stellar mass that's accurate (in some sense) to about 0.1 dex.
I tried a regression of the non-missing stellar mass estimates for the quench sample on absolute R magnitude and (r-z) color (all taken from the model (?) magnitude estimates in the quench database) with the following results:
Call:
lm(formula = cat.quench$log_mass ~ Mr.quench + rz.quench, na.action = na.exclude)

Residuals:
     Min       1Q   Median       3Q      Max
-1.62280 -0.03957 -0.00305  0.03358  2.34176

Coefficients:
             Estimate Std. Error t value Pr(> |t|)
(Intercept)  1.434138   0.032977   43.49   <2e-16 ***
Mr.quench   -0.392020   0.001555 -252.06   <2e-16 ***
rz.quench    1.173519   0.011388  103.05   <2e-16 ***
---
Signif. codes:  0 ‘***’ 0.001 ‘**’ 0.01 ‘*’ 0.05 ‘.’ 0.1 ‘ ’ 1

Residual standard error: 0.1069 on 2887 degrees of freedom
  (111 observations deleted due to missingness)
Multiple R-squared: 0.9653, Adjusted R-squared: 0.9653
F-statistic: 4.013e+04 on 2 and 2887 DF,  p-value: < 2.2e-16
Equivalently the mass to light ratio is estimated as:
Call:
lm(formula = cat.quench$log_mass + 0.4 * Mr.quench ~ Mr.quench +
    rz.quench)

Residuals:
     Min       1Q   Median       3Q      Max
-1.62280 -0.03957 -0.00305  0.03358  2.34176

Coefficients:
            Estimate Std. Error t value Pr(>|t|)
(Intercept) 1.434138   0.032977  43.490  < 2e-16 ***
Mr.quench   0.007980   0.001555   5.131 3.07e-07 ***
rz.quench   1.173519   0.011388 103.049  < 2e-16 ***
---
Signif. codes:  0 ‘***’ 0.001 ‘**’ 0.01 ‘*’ 0.05 ‘.’ 0.1 ‘ ’ 1

Residual standard error: 0.1069 on 2887 degrees of freedom
  (111 observations deleted due to missingness)
Multiple R-squared: 0.7867, Adjusted R-squared: 0.7865
F-statistic:  5324 on 2 and 2887 DF,  p-value: < 2.2e-16
This says that M/L depends weakly (but statistically significantly) on luminosity (i.e. absolute magnitude) and strongly on color, with a residual standard error of about 0.1 dex, which is fully consistent with Taylor et al.'s claimed precision. From these relations stellar masses can be estimated easily for the missing mass sample. Here is a stellar-mass color graph with the predicted masses for the missing mass sample shown in green.

BTW to calculate absolute magnitudes I used H0=70, Ω_m = 0.27. Your cosmology may differ.
Posted
-
 by
JeanTate
in response to mlpeck's comment.
by
JeanTate
in response to mlpeck's comment.
Very cool!
Did you include the outlier ("one object that I had already thrown out of my personal database because DR9 had classified it as a QSO with z = .96 +- .90 (!) and the photo showed two point-like objects in close proximity. That object is somewhere in JeanTate's list of outliers.")?
More curious - and perhaps troubling - is that these 'missing mass' objects include two stars and one overlap (only one, at most, of which could by your outlier)! 😮
What does it mean when this method produces nonsense results like this (a star clearly cannot have a stellar mass of >1 million sols)?
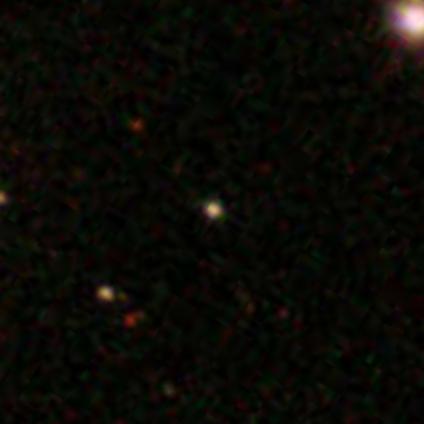
Here are the two stars: AGS00002ak, AGS00001z3
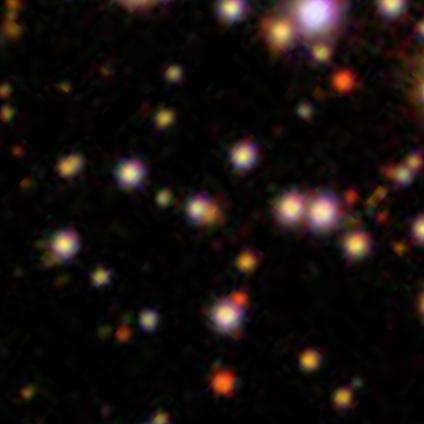
And here's the overlap AGS0000182:
Posted
-
by
mlpeck
Hi,
I had already thrown out that star/possible QSO combo from my personal database, which is why there were only 111 data points discarded for "missingness" in the model output. The other object with a negative redshift, which I assume is the other star, did not get a predicted mass estimate.
I did not check for any other oddness, so there are an even 3000 points in that graph including the ones with existing mass estimates and the newly predicted ones. Don't try to count them.
Posted
-
by
mlpeck
Quick additional thought. It's entirely possible that many of the objects in the low mass tail of that graph (say, 6 < log_mass < 8) are star-forming (or quenched) regions embedded in larger galaxies and that petrorad seriously underestimates the true galaxy size. And the color outliers could be due to overlaps or just bad data. Notice though that the ones that were predicted from colors and luminosities mostly fall within the densest part of the distribution.
OK, "8" followed by ")" got turned into an emoticon above, but I'm not going to try to figure out how to edit it right now.
Posted
-
by
mlpeck
Quick followup: It turns out the best way to fill in the missing stellar mass values is to use the DR9 database, which only had 2 missing values. Just for fun I compared the predicted estimates from the linear model I wrote about above with the ones tabulated in the DR10 database and got this:

The mean difference turned out to be 0.06 dex with a standard deviation of 0.18 dex. The standard error of the residuals in the model above was 0.11 dex, but prediction errors are larger than fit errors so we'd expect larger scatter here.
Posted
-
by
JeanTate
in response to mlpeck's comment.
"enter image description here"?
Posted
-
by
mlpeck
in response to JeanTate's comment.
You aren't seeing the graph? I'm uploading these to server space I pay for and hotlinking them here, which seems to be the only way to display an image on this forum.
Posted
-
by
JeanTate
in response to mlpeck's comment.
I've noticed this happening before (but cannot remember where! 😦): an image is loaded, using the Image tag, but does not display. Or rather, does not immediately display ... I can see the image now; perhaps I simply didn't wait long enough?
I'm pretty sure I guessed correctly, but:
- the x-axis is log_mass
- the green (horizontal) lines are the mean (dashed line) and 1 sigma above and below (fine dashed line)
- there are 109 (the original 112 "missing mass" objects, minus your sole outlier, minus the two still missing) datapoints
Posted
-
by
mlpeck
in response to JeanTate's comment.
Close. Sometime between the first post and today's I decided it was safe to discard the isolated star from my personal database. It turns out though that one previously estimated mass value went missing between DR7 and DR9, so just 109 previously missing values were filled in.
Heh -- now I can't see the graph. Anyway you are correct about the axes and horizontal green lines, and there are 109 points plotted.
Posted
-
 by
trouille
scientist, moderator, admin
by
trouille
scientist, moderator, admin
Mlpeck: Could you post a file that provides the DR9 masses for the sample and control sources that do not have masses in the current Tools data files? (I.e, the 112 in the post-quenched sample and the 5 in the control sample). That would be really helpful. My apologies if they're posted somewhere else within Talk!
I know we can't actually attach files yet in Talk (I'm hopeful someday we'll be able to, once we figure out where we could store the information). So by 'post', I mean -- could you put it in a dropbox.com or box.com folder that's open to the public? Or paste the results into a google spreadsheet that you make viewable to the public?
Also, it would be great if you could post a short description of how you get these masses (i.e., what SDSS site do you go to, what data you in put, etc.).
Thank you!
Posted
-
by
mlpeck
Welcome back.
I uploaded a CSV file with the quench sample missing mass objects only to a dropbox folder. The link is https://www.dropbox.com/s/vpx5wciivhkqhbo/mmiss.csv. I just opened the account and have no idea if anyone can download shared files.
To save time for me I included all fields that I stored in the data table. The stellar mass estimate is in the last column, with the catchy name lgm_tot_p50.
I got the data through the DR10 database on the CasJobs website at http://skyserver.sdss3.org/CasJobs/. The combination of plate, mjd, and fiber uniquely identify a spectrum in any data release, so I just uploaded a file containing those and used that to build up a table with the data I wanted to look at, which is a slight superset of the original data table in the tools here.
I created a group named "mlpeck" and have shared a couple of files to the group. If you (or anyone else for that matter) wants access to it all I need is your CasJobs user name.
Posted
-
by
mlpeck
Four of the 5 control objects with missing stellar masses had estimates in a later data release. I uploaded that table to https://www.dropbox.com/s/xxah2x2clv1qpm6/controlmmiss.csv.
Posted
-
by
JeanTate
Thanks mlpeck! 😃
I was able to download and open both files easily.
Thank you too for setting up the CasJobs III group (I have accepted your invitation there, and so can now see those files).
Posted
-
by
JeanTate
in response to mlpeck's comment.
To forestall an inevitable inquiry, there are 110 objects in this file, but 112 with 'missing mass' in the QS catalog.
The two 'double missing' objects are:
AGS00001z3 (DR7 ObjId 758878270823858940); this is not a galaxy, but a star:
AGS00002ak (758877274402460510); this is an overlap; the spectrum is that of the star/QSO, not the galaxy:
Posted
-
by
mlpeck
Yeah, I had dropped those two objects from my personal database. Their mass estimates would have remained missing anyway, which is appropriate. Now I've had to drop them again since they're still in the latest version of the quench data table.
Posted
-
by
trouille
scientist, moderator, admin
Great mlpeck. I'll have Ed upload these additional masses to Tools as soon as things settle for him in his travels (he just flew to Australia today for a conference).
Please do add me to the cas jobs group. My userid is: trouille2
Posted
-
 by
zutopian
by
zutopian
New paper:
A catalog of bulge, disk, and total stellar mass estimates for the Sloan Digital Sky Survey
J. Trevor Mendel (MPE), Luc Simard (HIA), Michael Palmer, Sara L. Ellison (UVic), David R. Patton (UVic)
(Submitted on 30 Oct 2013)
http://arxiv.org/abs/1310.8304Posted