What does that mean?: A Glossary of parameters available in Tools
-
 by
wassock
moderator
by
wassock
moderator
I'm posting this to get all this information in one place, I've just collected what others have posted. Please add any edits/revisions/additions below and I'll edit them into the top post. The posts below also contain some further information and discussions about some of the parameters, so if some thing isn't clear please scan through the whole thread.
Tools Data
RA (right ascension): the celestial longitude of an object's positionon the sky. Units are degrees.
**dec (**declination): the celestial latitude of an object's position on the sky. Units are degrees.
See http://www.physics.csbsju.edu/astro/sky/sky.11.html for more detailsu, g, r, i, and z: the measured brightnesses of the galaxy in each of five bands from the SDSS telescope. These are model mags from the DR8 catalog. Units are magnitudes.
Ultraviolet (u) 3543 Green (g) 4770 Red (r) 6231 Near Infrared (i) 7625 Infrared (z) 9134
Those are central wavelengths, in Å (10Å = 1 nm); source
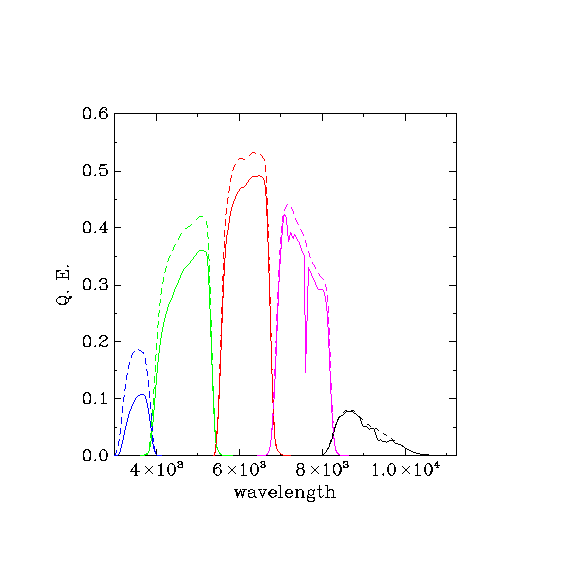
"The solid response curves show the througput defining the survey's photometric system, which includes extinction through an airmass of 1.3 at Apache Point Observatory. For reference, the dashed curves do not include any atmospheric extinction. These are sometimes loosely referred to as "filter curves" although they do include the full system response from atmosphere to detector." The x-axis is also in Å; source
Some background information (from vrooge: moderator)
First: color in an astronomy context is similar to a standard context, but the way you get there from data is to take a ratio of flux (= brightness) from the different SDSS filters, which sample different parts of the (mostly just the visible) electromagnetic spectrum. The filters are, from most blue to most red: u', g', r', i', z'. (Sometimes you can abbreviate and just drop the ' marks.)The catalogs show the magnitudes in ugriz, not the fluxes. There's a more detailed description of a magnitude on the SDSS website, but essentially, it's the logarithm of the flux, multiplied by -2.5 (for historical reasons, smaller magnitudes are brighter).
Because of the rules of logarithms, taking a difference of magnitudes is the same as taking a ratio of fluxes -- so a "color" in astronomy is the difference between magnitudes in two different filters. For example, u-r, or r-z.
(By convention, astronomers generally subtract the redder filter from the bluer filter; when you do that, higher numbers mean a redder color.)
Different colors tell you different things about a galaxy, so it's a very useful thing to plot. You can, for example, plot two colors against each other. You can plot a single color versus galaxy mass, or magnitude (preferably "absolute" magnitude, which is intrinsic brightness, so the effects of distance are accounted for; I don't think we have that for these galaxies yet).
Survey is pretty self-explanatory; in any case, every object is "sloan", which means SDSS (Sloan Digital Sky Survey). Anne Finkbeiner wrote a book about this, "A Grand and Bold Thing"UT. It is a very good book, describing a most amazing project.
LogMass The log (base10?) of the estimated mass of the galaxy
SDSS ID: the ID string for a galaxy from the Sloan database. Can be used to find additional information at sites like SkyServer. No units.
d4000 - measurement of the strength of the spectral break at 4000 Angstroms, which is a tracer of the (luminosit-weighted) age of a stellar population. The break occurs as the result of metal-line blanketing in the atmospheres of cool stars blue-ward of 4000 A, while in hot stars the metal species are all multiply ionized. The strength of the 4000A break therefore increases with increasing age of a stellar population as cooler stars dominate the stellar light
"Flux". (from JeanTate) There are six field (columns) which contain this word, and a corresponding six with "Flux Err": "Halpha", "Hbeta", "Nad Abs", "Nii", "Oii", these give a value for the size of the emission, or absorption, of light at key wavelengths caused by different elements. NB at the moment there is a glitch and the error values are the same as the flux values.
There are six field (columns) which contain this word, and a corresponding six with "Flux Err": "Halpha", "Hbeta", "Nad Abs", "Nii", "Oii", these give a value for the size of the emission, or absorption, of light at key wavelengths caused by different elements.
And the details are very important for both the data analysis and the meat of the paper we'll end up writing.
For example, "flux" isn't simply "the size of the emission, or absorption, of light" - there are several parameters which describe that (e.g. Equivalent Width, or EW) - it's an estimate of the energy per second per square cm (in our case) per Ångstrom (ditto). For example, "at key wavelengths caused by different elements" glosses over the fact that they're atomic transitions (in several cases blends of two or more transitions), and that some are of (excited) ions, others (excited) atoms.
"Halpha" and "Hbeta" are the first and second Balmer hydrogen linesWP, atomic transitions from the n = 3 to n = 2 (Halpha) and n = 4 to n = 2 levels. Each can be either emission (+ve values) or absorption (-ve), and for galaxies, it is possible for one to be emission and the other absorption.
"Nad" stands for Na D, the sodium D Fraunhofer linesWP. These are what causes a flame to turn yellow when you sprinkle salt into it. It is actually a doublet, two atomic transitions close together in wavelength, 589.0 and 589.6 nm. This PDF gives a nice overview: The sodium D-lines At the resolution of the SDSS spectrographs, the two lines are not easy to split; in any case in many galaxies the velocity dispersion smears them into one.
The remaining three - "Nii", "Oii", and "Oiii" - are nebular lines, once thought to be due to an undiscovered element, nebulium. They are all 'forbidden lines', atomic transitions with very low probabilities, and not ever seen in any lab spectrum. Why? Because the meta-stable excited states from which they arise are 'destroyed' by collisions, except in extremely low density gas, vacua so hard as to be unobtainable here on Earth.
"Oii" is a doublet, at 372.6 and 372.9 nm, due to singly ionized oxygen. According to Laura, the flux selected is just that from the 372.6 nm line.
"Nii" is the 658.4 nm [NII] (singly ionized nitrogen) emission line, per Laura. It is very interesting, in part because the other line in this doublet - at 654.8 nm - is on the other side of H-alpha
"Oiii" is the 500.7 nm [OIII] (doubly ionized oxygen) emission line per Laura. It is the strongest of a triplet, the others being at 495.9 and 436.4 nm.
Redshift is one of the most critical field in the whole database, and central to all work on extra-galactic astronomy (i.e. the study of stuff beyond our own galaxy1, including right out to the edge of what we can see, in our universe).
At a technical level, it refers to the difference between the observed (i.e. by SDSS spectrographs) wavelength of a 'line' (see a later explanation) from a galaxy and the wavelength of the same line in a lab here on Earth (more exactly, the ratio of the observed wavelength over the 'lab' wavelength, minus 1). You can measure redshift for each line you can unambiguously identify in a spectrum; if they all come from the same source, the redshifts will all be the same. The SDSS spectroscopic pipeline does all this automatically, using the distilled wisdom of over a century of astronomy and physics2.
Why is redshift so important? Because it is a proxy for distance!
Einstein's theory of General Relativity predicts that, in an expanding universe, every observer will see distant objects 'redshifted'; the light detected will have a longer wavelength than the light emitted. And the greater the distance between a pair of objects, the greater the redshift. There are caveats and exceptions, of course, but generally speaking galaxies outside the Local Group will have redshifts greater than zero - they will appear to be moving away from us.
Hubble is credited with having discovered the empirical relationship between redshift and distance (in fact Milton Humason is a nearly forgotten co-discovererWP), today called the Hubble law, or the Hubble relationship: for most SDSS galaxies, their distance from us is equal (more or less) to their redshift multiplied by the 'Hubble constant'.
Redshift Err is the estimated error in the redshift. Crudely, if the redshift is listed as 0.14071, say, and the redshift error as 0.0000205044, you can treat this as a redshift of 0.14071 ± 0.00002. Which is about the same as saying there's a ~67% (error = 1SD) chance that the redshift lies between 0.14069 and 0.14073.
a quantitative measure of energy (the erg is the cgs unit of energy) per time ('s' stands for 'second') per area per unit wavelength ("Ang" stands for Ångstrom, a non-standard unit of length, equal to 10-10 m, or 0.1 nm; yes, astronomers just love their non-standard units!).
petrorad_50_r: the apparent radius of a galaxy measured in the r-band. Units are arcseconds (arcsec).
V_disp (from JeanTate) "V_disp" is velocity dispersion, an estimate of the sigma of the velocity distribution (assumed to be a Gaussian) of the stars and gas in the galaxy (or at least within the part of it observed by the spectrograph), derived from some average of the widths of the identified lines in the spectrum (i.e. assuming that the line widths are due to relative line-of-sight motion, a.k.a. Doppler shift). The details are really messy, see here, for example.
This parameter can be used for several purposes, for example, estimating total mass (cf the stellar mass that what "log_mass" is an estimate of).
plateid (From Nax)
Each spectroscopic exposure employs a large, thin, circular metal plate that positions optical fibers via holes drilled at the locations of the images in the telescope focal plane. These fibers then feed into the spectrographs. Each plate has a unique serial number, which is called plate in views such as SpecObj in the CAS. In APOGEE data in DR10 and later, note that while "plate" is commonly used interchangeably with Design, multiple plates may exist for the same design (i.e. for the same set of stars). For example, two plates may have identical targets but be drilled for observations at different hour angles, temperatures, or epochs, thereby making them unique plates with different Plate IDs.
Fiberid (from Nax)
The SDSS spectrograph uses optical fibers to direct the light at the focal plane from individual objects to the slithead. Each object is assigned a corresponding fiberID.
Other Terms
absolute size: the physical radius of a galaxy measured in the r-band, based on its apparent size on the sky and how far away it is. Units are kiloparsecs (kpc).
Abs R: the true brightness (absolute magnitude) of the galaxy in r-band, based on its apparent brightness and distance from us. Units are magnitudes.
BPT Diagram - a BPT diagram can tell you if the light from a galaxy is dominated by recent star-formation or by an active galactic nucleus (AGN), which contains a supermassive black hole (SMBH). See here for JeanTates fuller explanation
u(mag) apparent magnitude for the galaxy in the u-band filter.
Posted
-
 by
JeanTate
by
JeanTate
There is at least one outlier in the data, AGS00001y8 (a.k.a. SDSS DR7 ObjId 587740714039312783 - see the SDSS ID not found. thread) - all its emission line fluxes are nonsense. Once you filter out that (and, for Halpha, maybe one or two other outliers), the plots should be more reasonable.
However, there are still 'non-physical' data; for example, objects with negative oiii_flux (something I'll cover in later posts).
Posted
-
 by
jtmendel
scientist, moderator
by
jtmendel
scientist, moderator
D4000 - measurement of the strength of the spectral break at 4000 Angstroms, which is a tracer of the (luminosit-weighted) age of a stellar population. The break occurs as the result of metal-line blanketing in the atmospheres of cool stars blue-ward of 4000 A, while in hot stars the metal species are all multiply ionized. The strength of the 4000A break therefore increases with increasing age of a stellar population as cooler stars dominate the stellar light.
Posted
-
by
wassock
moderator
in response to jtmendel's comment.
thanks jt
Posted
-
by
JeanTate
Need definitions for the wavelengths covered by the 5 bands would be good too (sure I've seen that somewhere but couldn't find it):
Ultraviolet (u) 3543
Green (g) 4770
Red (r) 6231
Near Infrared (i) 7625
Infrared (z) 9134Those are central wavelengths, in Å (10Å = 1 nm); source
"The solid response curves show the througput defining the survey's photometric system, which includes extinction through an airmass of 1.3 at Apache Point Observatory. For reference, the dashed curves do not include any atmospheric extinction. These are sometimes loosely referred to as "filter curves" although they do include the full system response from atmosphere to detector." The x-axis is also in Å; source
Posted
-
by
JeanTate
I'm posting this to get all this information in one place, I've just collected what others have posted. - it might be nice to include links to the Quench Talk posts from which these were extracted (there's often much more info, of possible interest to readers, in those source posts).
Posted
-
by
JeanTate
There are six field (columns) which contain this word, and a corresponding six with "Flux Err": "Halpha", "Hbeta", "Nad Abs", "Nii", "Oii", these give a value for the size of the emission, or absorption, of light at key wavelengths caused by different elements.
You left out "Oiii", and it's a good deal more complicated than that! 😮 And the details are very important for both the data analysis and the meat of the paper we'll end up writing.
For example, "flux" isn't simply "the size of the emission, or absorption, of light" - there are several parameters which describe that (e.g. Equivalent Width, or EW) - it's an estimate of the energy per second per square cm (in our case) per Ångstrom (ditto). For example, "at key wavelengths caused by different elements" glosses over the fact that they're atomic transitions (in several cases blends of two or more transitions), and that some are of (excited) ions, others (excited) atoms.
"Halpha" and "Hbeta" are the first and second Balmer hydrogen linesWP, atomic transitions from the n = 3 to n = 2 (Halpha) and n = 4 to n = 2 levels. Each can be either emission (+ve values) or absorption (-ve), and for galaxies, it is possible for one to be emission and the other absorption.
"Nad" stands for Na D, the sodium D Fraunhofer linesWP. These are what causes a flame to turn yellow when you sprinkle salt into it. It is actually a doublet, two atomic transitions close together in wavelength, 589.0 and 589.6 nm. This PDF gives a nice overview: The sodium D-lines At the resolution of the SDSS spectrographs, the two lines are not easy to split; in any case in many galaxies the velocity dispersion smears them into one.
The remaining three - "Nii", "Oii", and "Oiii" - are nebular lines, once thought to be due to an undiscovered element, nebulium. They are all 'forbidden lines', atomic transitions with very low probabilities, and not ever seen in any lab spectrum. Why? Because the meta-stable excited states from which they arise are 'destroyed' by collisions, except in extremely low density gas, vacua so hard as to be unobtainable here on Earth.
"Oii" is a doublet, at 372.6 and 372.9 nm, due to singly ionized oxygen. According to Laura, the flux selected is just that from the 372.6 nm line.
"Nii" is the 658.4 nm [NII] (singly ionized nitrogen) emission line, per Laura. It is very interesting, in part because the other line in this doublet - at 654.8 nm - is on the other side of H-alpha
"Oiii" is the 500.7 nm [OIII] (doubly ionized oxygen) emission line per Laura. It is the strongest of a triplet, the others being at 495.9 and 436.4 nm.
Posted
-
by
JeanTate
"V_disp" is velocity dispersion, an estimate of the sigma of the velocity distribution (assumed to be a Gaussian) of the stars and gas in the galaxy (or at least within the part of it observed by the spectrograph), derived from some average of the widths of the identified lines in the spectrum (i.e. assuming that the line widths are due to relative line-of-sight motion, a.k.a. Doppler shift). The details are really messy, see here, for example.
This parameter can be used for several purposes, for example, estimating total mass (cf the stellar mass that what "log_mass" is an estimate of).
Posted
-
by
Nax
From the SDSS glossary.
Fiberid:
The SDSS spectrograph uses optical fibers to direct the light at the focal plane from individual objects to the slithead. Each object is assigned a corresponding fiberID.
Plateid:
Each spectroscopic exposure employs a large, thin, circular metal plate that positions optical fibers via holes drilled at the locations of the images in the telescope focal plane. These fibers then feed into the spectrographs. Each plate has a unique serial number, which is called plate in views such as SpecObj in the CAS. In APOGEE data in DR10 and later, note that while "plate" is commonly used interchangeably with Design, multiple plates may exist for the same design (i.e. for the same set of stars). For example, two plates may have identical targets but be drilled for observations at different hour angles, temperatures, or epochs, thereby making them unique plates with different Plate IDs.
Posted
-
by
wassock
moderator
by trouille MODERATOR, SCIENTIST
karthikeyan.d posted this question, that I wanted to pop out as its own discussion thread.I see that there is a guide for the Prompt commands. Can you add a guide for the Axis variables too? I followed the step-through tutorial and created a scatterplot with log mass in the X axis. However, I don't know what "log mass" is. (Mass in a log scale?) I understand some of the options but it will be useful to have a guide that explains the different options.
Posted
-
by
wassock
moderator
by trouille MODERATOR, SCIENTIST
It'd be great if others jumped in and provided short sentence descriptions for all the parameters. I'll start:
RA = Right Ascension Dec = Declination. See http://www.physics.csbsju.edu/astro/sky/sky.11.html for more details
u(mag) = apparent magnitude for the galaxy in the u-band filter.
See http://en.wikipedia.org/wiki/Magnitude_(astronomy) for info about our weird choice of how to assign brightness to objects in astronomy. (Oh, if we could only rewrite history and have a do-over for this one!).
See http://skyserver.sdss.org/dr1/en/proj/advanced/color/sdssfilters.asp for a nice tutorial about the SDSS filters.
OK, others, jump in! I'll check back in tomorrow and fill in info about any categories that remain un-described.
Respond Posted 6 days ago
Posted
-
by
wassock
moderator
by trouille MODERATOR, SCIENTIST
Just saw that there's a series of posts with descriptions of parameters here: http://quenchtalk.galaxyzoo.org/#/boards/BGS0000001/discussions/DGS00000hf
KWillett posted, among other useful pieces of info: RA (right ascension): the celestial longitude of an object's positionon the sky. Units are degrees.
dec (declination): the celestial latitude of an object's position on the sky. Units are degrees.
absolute size: the physical radius of a galaxy measured in the r-band, based on its apparent size on the sky and how far away it is. Units are kiloparsecs (kpc).
petrorad_50_r: the apparent radius of a galaxy measured in the r-band. Units are arcseconds (arcsec).
SDSS ID: the ID string for a galaxy from the Sloan database. Can be used to find additional information at sites like SkyServer. No units.
u, g, r, i, and z: the measured brightnesses of the galaxy in each of five bands from the SDSS telescope. These are model mags from the DR8 catalog. Units are magnitudes.
Abs R: the true brightness (absolute magnitude) of the galaxy in r-band, based on its apparent brightness and distance from us. Units are magnitudes.
Posted
-
by
wassock
moderator
by JeanTate
"Survey" is pretty self-explanatory; in any case, every object is "sloan", which means SDSS (Sloan Digital Sky Survey). Anne Finkbeiner wrote a book about this, "A Grand and Bold Thing"UT. It is a very good book, describing a most amazing project.
"Sdss Id" is the unique "ObjId" (Object ID) of the galaxy, in the 7th data release from SDSS, a.k.a. DR7. This is a little odd, because the images we were served up to classify are from the DR8 photometric pipeline, which was developed independently, and produces results that look - in a great many cases - rather different from the DR7 JPG images of the same object. And DR10, which is just out, is different again.
(to be continued)
Posted
-
by
wassock
moderator
by JeanTate
"Redshift" is one of the most critical field in the whole database, and central to all work on extra-galactic astronomy (i.e. the study of stuff beyond our own galaxy1, including right out to the edge of what we can see, in our universe).
At a technical level, it refers to the difference between the observed (i.e. by SDSS spectrographs) wavelength of a 'line' (see a later explanation) from a galaxy and the wavelength of the same line in a lab here on Earth (more exactly, the ratio of the observed wavelength over the 'lab' wavelength, minus 1). You can measure redshift for each line you can unambiguously identify in a spectrum; if they all come from the same source, the redshifts will all be the same. The SDSS spectroscopic pipeline does all this automatically, using the distilled wisdom of over a century of astronomy and physics2.
Why is redshift so important? Because it is a proxy for distance!
Einstein's theory of General Relativity predicts that, in an expanding universe, every observer will see distant objects 'redshifted'; the light detected will have a longer wavelength than the light emitted. And the greater the distance between a pair of objects, the greater the redshift. There are caveats and exceptions, of course, but generally speaking galaxies outside the Local Group will have redshifts greater than zero - they will appear to be moving away from us.
Hubble is credited with having discovered the empirical relationship between redshift and distance (in fact Milton Humason is a nearly forgotten co-discovererWP), today called the Hubble law, or the Hubble relationship: for most SDSS galaxies, their distance from us is equal (more or less) to their redshift multiplied by the 'Hubble constant'.
"Redshift Err" is the estimated error in the redshift. Crudely, if the redshift is listed as 0.14071, say, and the redshift error as 0.0000205044, you can treat this as a redshift of 0.14071 ± 0.00002. Which is about the same as saying there's a ~67% chance that the redshift lies between 0.14069 and 0.14073.
1 Strictly speaking, beyond the Local Group of galaxies
2 Actually the pipeline produces, potentially, several different estimates of redshift. One set of estimates is from 'lines'; a completely different estimate comes from 'template fitting', using a metric called the 'cross-correlation function' (if anyone would like me to have a go at explaining this, in simple terms, please say so).
Posted
-
by
wassock
moderator
by JeanTate
"Flux". There are six field (columns) which contain this word, and a corresponding six with "Flux Err": "Halpha", "Hbeta", "Nad Abs", "Nii", "Oii", and "Oiii". I'll get to each in a later post; first, flux.
It's easy enough to understand that two stars may differ in brightness; we say things like 'Sirius is brighter than Rigel' or 'which of the stars in the Southern Cross is the faintest?'. And although we may shake our heads at the, um, eccentricity of astronomers in using such a crazy-seeming method to quantitatively measure brightness as 'magnitudes', at least it makes some kind of intuitive sense: the brightest star has a magnitude of ~-1, the faintest visible, 6.
When a star's (or galaxy's) light is split into component wavelengths by a spectrograph, with 'brightness' on the vertical axis (the y-axis) and wavelength on the x-axis, what units do we use for the y-axis?
Here's a SDSS DR8 spectrum, of AGS000015v (a.k.a. SDSS J161352.18+302350.3, a.k.a. DR8 ObjId 1237662337330380979):
enter image description here
The "f" in the axis name stands for "flux". From the rest of the stuff - "erg/s/cm2/Ang" - you can probably work out that flux is a quantitative measure of energy (the erg is the cgs unit of energy) per time ('s' stands for 'second') per area per unit wavelength ("Ang" stands for Ångstrom, a non-standard unit of length, equal to 10-10 m, or 0.1 nm; yes, astronomers just love their non-standard units!).
And the subscript λ (the Greek lower-case letter 'lambda')? That stands for wavelength (hence the "Ang"), and points to the fact that there are two different kinds of flux! One is 'per unit of wavelength' - hence the λ - and the other is ... well, anyone care to hazard a guess?
But why? Why this, um, really strange thing? Why not simply say energy, or power (which is energy per unit time)?
A really good question ... for another day.
Posted
-
by
wassock
moderator
in response to JeanTate's comment.
Jean - re links to the original posts - trouble is you can't link to the specific post just to the wholethread. Most of the original posts have now been added to the thread, I've reposted them so that the full collected glossary still comes out at the top of the thread
Posted
-
by
ChrisMolloy
Hi Wassock, Jean
I think this is amazing and have been watching this glossary evolve. Very helpful. Just a question for you and Trouille. Is there a way all this data could be put into a Glossary Field that could continually evolve say below the hashtag field. Something similar to the SDSS glossary but with relevant guides instructions to the dashboard and it's use?. I don't know what the time constraints are for this but it could be better than following a blog. I had wondered whether the same could be done for the hashtags also (which isn't relevant to what I'm asking) but which could be applied to all the projects and added to as and when needed.
Posted
-
 by
klmasters
scientist
by
klmasters
scientist
This is great - a really helpful resource. Are there any terms you're still struggling with, or all set now?
Jean - we use flux, rather than energy or power, to indicate it's a measurement at the telescope, rather than at the source. The flux drops as the cube of the distance from the source (as it's spreads out in an ever increasing sphere around the source), while we retain energy or power to mean the emitted flux (ie. the flux at the source). So astronomers present raw data as fluxes, and then use redshifts to estimate distances and use the estimated distance to estimate what power was emitted by the source to create that flux - make sense.
Yesterday Brooke (vrooje) was working on calculating the distances for the sample from the redshifts and I think she said she would get that put into the sample.
Karen.
Posted
-
by
JeanTate
in response to klmasters's comment.
Thanks Karen.
I have a question about d4000: as it's due to 'line blanketing' ("a break in the spectrum created by lots of metal lines in the atmospheres of low mass stars - you don't see it where there are young stars dominating the light, but it gets revealed as they die off" as you put it in another thread), won't its strength also depend - heavily - on metallicity1?
1 the relative abundance of 'metals' (astronomer-speak for all elements other than H and He)
Posted
-
by
JeanTate
in response to jtmendel's comment.
As Karen explains in this thread, "D4000" (or "Dn(4000)") comes in several different forms, somewhat akin to "Oiii_flux" being ambiguous (which [OIII] line does it refer to?).
The one used in QS is, apparently, "d4000_n", in the DR9 galSpecIndx table, not "d4000"; i.e. Dn(4000) per the "Balogh et al (1999) definition". More details on this SDSS SkyServer webpage.
Posted
-
by
wassock
moderator
in response to ChrisMolloy's comment.
Hi Chris, I assume that to do something like the #tags list will need someone to fiddle with the html for the page. This thread is fairly simple to administer and should stay easy to find. Plus you'd have to get everyone to agree what the terms mean first!
Posted
-
by
ChrisMolloy
Hi Wassock,
I did think about that later as the threads are easy to navigate once you get used to them. And using the search facility to find an answer is useful and fun. Also other data is easily accessible from other sites for definitions, help etc, and looking at other peoples dashboards is a good way to learn how to use the dashboard and see how the data is being used. Thanks for the response. C
Posted