Tools: questions, issues, and comments
-
 by
KWillett
scientist
by
KWillett
scientist
Hi everyone,
Part of the GZQ project is using the new analysis tools at http://tools.zooniverse.org - we hope anyone interested can try them out. At the moment, we don't have any tutorials set up for the site; we hope to make these by the time classifications have finished. In the meantime, please post any questions or comments about the tools in this thread, and we'll respond as soon as we can.
Posted
-
Perhaps a brief description of the various axis units and other terms used in the tools?
Posted
-
 by
JeanTate
by
JeanTate
Not a question yet - tutorials badly needed first - just a comment to say THANK YOU VERY MUCH Development Team! 😃
These look truly awesome.
Posted
-
by
KWillett
scientist
Good question on the axis units. I'll note that a couple of them are not correctly labeled - I just submitted a bug report, and they should be changed ASAP. The data currently provided are:
- RA (right ascension): the celestial longitude of an object's positionon the sky. Units are degrees.
- dec (declination): the celestial latitude of an object's position on the sky. Units are degrees.
- absolute size: the physical radius of a galaxy measured in the r-band, based on its apparent size on the sky and how far away it is. Units are kiloparsecs (kpc).
- petrorad_50_r: the apparent radius of a galaxy measured in the r-band. Units are arcseconds (arcsec).
- SDSS ID: the ID string for a galaxy from the Sloan database. Can be used to find additional information at sites like SkyServer. No units.
- u, g, r, i, and z: the measured brightnesses of the galaxy in each of five bands from the SDSS telescope. These are model mags from the DR8 catalog. Units are magnitudes.
- Abs R: the true brightness (absolute magnitude) of the galaxy in r-band, based on its apparent brightness and distance from us. Units are magnitudes.
Posted
-
by
JeanTate
in response to KWillett's comment.
Thanks Kyle! 😃
Now I have some questions! 😉
"physical radius of a galaxy measured in the r-band, based on its apparent size on the sky and how far away it is" - presumably "effective radius", from one of the ellipsoidal radial intensity profile fits (modeled as either exponential or deVaucouleurs, right?); what values of the (presumably LCDM) cosmological model?
"Abs R: the true brightness (absolute magnitude) of the galaxy in r-band" - corrected for (foreground, galactic) extinction (a.k.a. reddening)? K correction applied (or not)? If so, which?
Posted
-
by
KWillett
scientist
Hi Jean,
The absolute size is derived from the petrorad_50_r (50% Petrosian radius of the galaxy in r-band); it's then converted to a physical size using the angular diameter distance derived from the redshift. We used a cosmology of (omega_lambda, omega_m, h_100) = 0.7, 0.3, 0.7. Petrosian radii doesn't explicitly assume an intensity profile - it's based on taking the ratio of an annulus of light at some distance to the amount of light within the annulus, then adding up all the light within. See http://cas.sdss.org/dr6/en/help/docs/algorithm.asp?key=mag_petro for more information.
Absolute magnitudes are corrected for Galactic extinction and are k-corrected to z=0.
Posted
-
Hi,
I don't get the tools running with Internet Explorer 9.
Best,
HermanPosted
-
 by
GeoffRoynon
moderator
by
GeoffRoynon
moderator
I tried the link from the first post and simply get a blank window - using Safari 6.0.5 and Firefox 22.0 and Chrome 28.0
Is it down or just not working?
Posted
-
 by
vrooje
moderator, scientist
by
vrooje
moderator, scientist
Hi Geoff,
Is it completely blank or does it have the zootools header and footer?
The first time I went to Tools (I'm using Chrome as well) it looked like a blank page, but it was just because I hadn't set up a dashboard or imported any data. I suppose we should probably suggest to the development team that the default page should be the "Data" page if there are no dashboards set up, but currently you'll have to click manually to be able to import your collections or recent classifications.
However, maybe there's a better way -- I don't have much experience with Tools either so I'm looking forward to getting to know it better too. 😃
Posted
-
 by
lpspieler
moderator
in response to GeoffRoynon's comment.
by
lpspieler
moderator
in response to GeoffRoynon's comment.
Hi Geoff,
I had the same issue.
The page loaded correctly when I first logged in to quench and then followed any link to Tools.
That notwithstanding it would be nice if we could log in to Tools directly without having to log in to quench first.
UPDATE: after signing out directly from Tools it was displayed as it should be: with the blue log-in bar that is also available for Talk forums. But when not being logged in before (I don't know whether only quench or any other project counts) this blue log-in bar is missing when I load the tools page.
Posted
-
 by
jules
moderator
by
jules
moderator
The tools links are working fine for me (Firefox / windows vista) but the only data available seems to be my Galaxy Zoo recents / favourites etc rather than my Quench classifications. I'm just back from holiday and may well have missed something!! 😉
Posted
-
by
GeoffRoynon
moderator
It does work if you're signed on - maybe have a default message on the window saying that you need to be logged in to use tools.
Posted
-
 by
edpaget
in response to jules's comment.
by
edpaget
in response to jules's comment.
jules, can you make sure you're in the Quench project? It should say ZooTools - Quench in the upper left hand corner.
Posted
-
by
edpaget
in response to Herman van Wietmarschen's comment.
Sorry Herman, the Tools, as of now, only support IE 10, when development stabilizes a bit further I will try to get it working with IE9.
Posted
-
by
vrooje
moderator, scientist
Update: you can read a bit more about how to use Tools here:
http://blog.zooniverse.org/2013/07/22/zoo-tools-a-new-way-to-analyze-view-and-share-data/Posted
-
by
jules
moderator
in response to edpaget's comment.
by edpaget in response to jules's comment
"jules, can you make sure you're in the Quench project? It should say ZooTools - Quench in the upper left hand corner."
Thanks! Got it!
Posted
-
 by
trouille
scientist, moderator, admin
by
trouille
scientist, moderator, admin
Dear all,
Check out the new Quench Tools tutorial, introduced here.
Also, for future questions about Quench Tools, could you post the comments within that discussion board (i.e., Help - Tools). Thanks!
Posted
-
 by
wassock
moderator
by
wassock
moderator
Hi just playing with the tools plotting redshift against RA for the Quench Control data gives this:
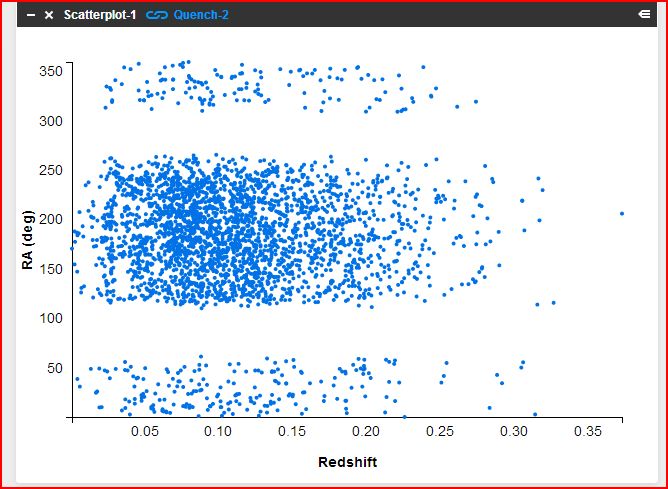
Why the gaps, are there chunks of sky we're not looking at?
Posted
-
by
JeanTate
in response to wassock's comment.
Yes. Here is a plot of the SDSS DR9 sky coverage, in equatorial coordinates, centered on RA=90 (source):
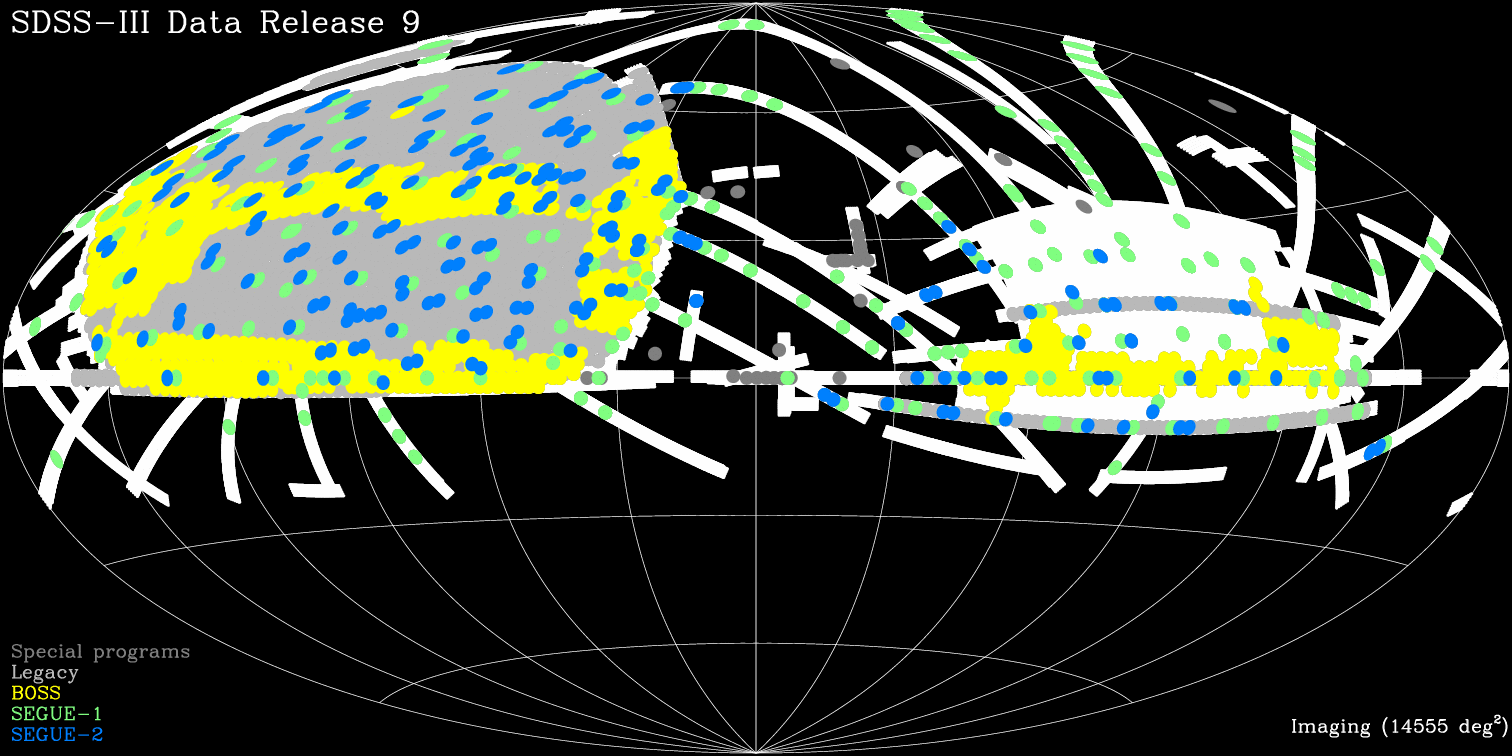
The snake-like strip where there is little to no coverage is the plane of the Milky Way. I was not able to quickly find a graphic which plots the Milky Way with the same projection and coordinate axes, but this comes fairly close (source):

Posted
-
Hi, I'm having some trouble with using the Prompt mechanism to create new fields. I've followed the notes on edpaget's GitHub page https://github.com/edpaget/uPrompt.
The operators '+', '-', '*' appear to work.
New Field test_add, .u + .g
New Field test_sub, .u - .g
New Field test_mul, .u * .g
The operators '/', '^', 'log', 'recip' are not accepted.
New Field test_div, .u / .g
New Field test_sqr, .u ^ 2
New Field test_log, log .u
New Field test_rec, recip .u
Obviously these are not exhaustive tests. Random thought: perhaps we don't have the latest parser tweaks?Any help much appreciated. 😃
Posted
-
by
edpaget
in response to james_involute's comment.
Hey james, I think I've fixed those problems, as well as slightly updating the syntax of the Prompt. (mostly getting rid of those extraneous News).
Posted
-
by
JeanTate
in response to edpaget's comment.
Hmm, I've just finished trying much the same set of operations, and got the same results!
Should I start again from scratch? Perhaps the fixes didn't apply while I was working?
Specifically: neither "log" nor "/" works, but "+", "-" (both subtract and negate), and "*" do.
In the case of "log", what is the syntax? "log(.blah)" or "log .blah" or ...
Posted
-
 by
james_involute
in response to edpaget's comment.
by
james_involute
in response to edpaget's comment.
Hi Ed,
I've posted some more feedback in the Help/Tools board.
Thanks, JamesPosted
-
by
james_involute
in response to JeanTate's comment.
Jean, I did start from scratch quite aggressively as, amongst other things, I had some stale fields in the table I was working with. After starting a new dash board and moving to the control data set then back to quench (I have no idea if that was significant) and creating a new table I was able to successfully use the new prompt syntax and the '/', '^' and 'recip' operators but not 'log' (see my help/tools post).
PS I only found the shortcomings while trying to brew up a solution for the BPT graph that's been discussed elsewhere!!!!
Posted
-
by
JeanTate
in response to james_involute's comment.
@james: yeah, it occurred to me, after I'd posted my 'bad news' results, that I should have tried with a totally different dataset (I worked on the same 'white' collection of mine, both times). I also did not try close the Tools window (nor browser); ditto didn't try logging out and back in. There's also always the last resort of rebooting ...
Oh, and yes, all my trials have also been done with the ultimate aim of creating a BPT-like diagram (for readers who don't know what we're referring to, here is a Quench Talk thread I began: Automated creation of BPT diagrams, in GZ Tools? ).
Posted
-
by
wassock
moderator
There is a degree of emphasis on how good it would be to have 'novices' (like me) look at the data here but there's a real need for some clear guidance on what's going on all in one place so that we can make enough sense of it all to ask those important 'stupid questions' that may take us on to new perspectives and so on.
Could do with a definition of what's in the Quench Sample and Control data sets and there's a desperate need for all the parameters available to play with in tools to be defined - and the axis scales for the quench data needs to be sorted tooPosted
-
by
JeanTate
in response to wassock's comment.
I'm kinda puzzled wassock, if you're a MODERATOR, how can you be a novice?
Several of the questions you ask in this post have been asked by others before, in several different places.
Taking just this one - because I think I can make a fairly good guess as to what part of the answer is:
there's a desperate need for all the parameters available to play with in tools to be defined
As far as I know, karthikeyan.d was the first to ask something like this, in the Tools: questions, issues, and comments thread ("July 19 2013 3:10 PM"), and Laura copied that question into the Guide for parameters in tables of data provided in Quench Tools thread, in the Tools board. Which is not stickied (pinned). So it's now down on page 2 (which may be why you didn't see it).
I think Laura is hoping that ordinary zooites and mods will jump in to that thread, and write posts which provide answers, for all parameters etc. And I think that's a worthy aim, and if it happens, it'll be great.
For what it's worth, I could do pretty much that - attempt answers, I'm sure I'd get plenty wrong - but the thought occurred to me, well over a week ago now, "I wonder who else will do this? What if I hang back, for a few days, will anyone do anything?"
Posted
-
by
wassock
moderator
Hi Jean as I understand it the moderators from all the various zooniverse projects were invited to come play. I moderate over at planetfour and have only played with galaxyzoo before now. Assume the idea is that this gives a group of involved people to start with who at least have an understanding of how the boards work. I am really tight for time but I'll try to drag the relevant bits together and sticky something. Then let those who know better edit it straight. The flux data thing is a pain - have you tried plotting any of it?
EDIT - finally found time to actually read the instructions, so now I can play with the filters and edit out the outliers which were mucking things up.
Posted
-
by
lpspieler
moderator
I think I've found something which could be called a bug or at least unpleasant behavior:
In some arbitrary diagram after I have chosen the data source for that diagram and I've chosen the display parameters (for example what data to assign to which axis) changing the data source again doesn't trigger a redraw of the diagram.
I first have to assign other data columns to the axis - first redraw - then assign (again) the data columns I actually wanted - second redraw.It would be nice if the diagram were refreshed as soon as I switch to another data source without having to change the other diagram settings.
Posted
-
by
mbond
Hi,
I would like to understand what are the different fields of the Quench and Control data. I searched the SDSS Glossary but could not find explanations. In particular, I would like to understand the following fields:
Log Mass: I guess it is the log10 of the galaxy mass in solar masses. But how it is evaluated? is the dark matter taken into account?
D4000: ???
Halpha flux: in which units?
Nad Abs Flux: ???
V Disp: ???
Thanks in advance.
Regards,
Michel
Posted
-
by
JeanTate
in response to mbond's comment.
Check out What does that mean?: A Glossary of parameters available in Tools.
If you still have questions, please don't hesitate to ask! 😃
Posted
-
by
lpspieler
moderator
Hello,
another somewhat annoying feature:
if I follow a link to someone else's dashboard just to view that dashboard, not edit it, I will often have to move the windows of that dashboard around a little in order to see them better. But each time I move a window I get that nasty modal message box telling me that as long as I haven't copied the dashboard I'm not allowed to modify it.
I've got that message the very first time. Couldn't tools just temporarily keep the window positions while I'm viewing the dashboard instead of saving them? I really don't understand why I need to be shown this message box over and over again.
Posted
-
by
lpspieler
moderator
And yet another one:
The "download data" option doesn't seem to work for me. I click the button after data is ready, and then nothing happens.Browser: Firefox 22.0
Posted
-
by
lpspieler
moderator
Hmm, as soon as I create some more tables and plots in one dashboard then tools becomes pretty unstable. Clicking and dragging the diagrams around becomes ever more difficult (they just don't follow your mouse drag), minimizing and maximizing them becomes equally difficult.
Oh - and generally: dashboards seem to remember the location of tables/diagrams. But they don't seem to remember the maximized/minimized state. If I tidy up a dashboard by minimizing all my tables/charts, and I return to that dashboard later then I find all tables/charts maximized.
Posted
-
by
lpspieler
moderator
Now it really stopped working: When copying one of my own dashboards and creating a new plot from one of the data sources I am not offered the columns that should be present in the data source. No columns are offered at all for the axes!
Just to be clear: before trying to create a new plot I reloaded the data. But nevertheless I can't choose columns when trying to create plots.
At least newly created dashboards still seem to work.
This means that I simply can't use half of tools anymore because the main functionality has stopped working!
Posted
-
by
lpspieler
moderator
Another glitch: The bin settings in histograms are useless: The chosen number of bins is distributed over the available data:
If a certain part of the possible value range is not populated then there is no bin for this part of the data range.
This leads to wildly differing min and max values of the bins, even if the value range and the number of chosen bins are exactly between two histograms. You really can't compare the data distribution in this way.Posted
-
by
jules
moderator
-
The name of the dashboard is sometimes overlaid by part of the Menu (Tools, Data etc). Makes renaming a dashboard tricky!
-
After copying a dashboard I have to close down the copy (ie go back to Dashboards) and open it again before I can work with it.
-
It would be great to be able to toggle filters on and off.
Posted
-
-
by
lpspieler
moderator
Data filters in scatterplots don't seem to work.
If the data associated to the Y axis has a value span from negative to positive values
I am unable to filter out the negative values by assigning a Ymin of 0.
Any other minimum value (e.g. Ymin=-0.5) also doesn't work.
The data points with Y values lower than the specified Ymin are not filtered out.Posted
-
by
JeanTate
in response to lpspieler's comment.
You may already be doing this, but somewhere - in some comment some days ago - EotG (may have changed his handle; "EdwardohtheGreat") mentioned that you need to "refresh" ... which means reload (or whatever the button on your browser says).
Whether that's relevant in the cases you describe, lpspieler, I have no idea ... but it's at least worth trying, eh?
Posted
-
by
lpspieler
moderator
in response to JeanTate's comment.
Hi Jean,
refreshing, logging off and on, didn't help against:
- the min value filter problem with scatter plots and histograms
- the problem with different start and stop values of bins in
histograms - the stability issues with many open windows
- the fact that windows don't remember their minimized/maximized state
- Jules' and my problem that the dashboard title is covered by the
tools menu
I guess it's fair to asssume that at least a few of the other glitches I noted also won't go away by these methods.
Posted
-
by
lpspieler
moderator
Scatterplots will always put the lowest Y value of all data points at the origin. It would be nice if we could force diagrams to have Y=0 as origin (again for the sake of comparability)
Posted
-
by
jules
moderator
Sometimes a non-whole number value would work best as the lowest Y axis value but Tools won't accept values such as 0.2, seems it has to be a whole number.
Posted
-
by
jack9515
Whenever I load up tools and create a dashboard the screen is blank apart from the header and footer. I have logged on before and it worked fine but I didn't finish the tutorial before I had to stop. Sometimes when I log out the tutorial will pop up but whenever I try and use it the window just shoots off screen, can you help?
Posted
-
by
lpspieler
moderator
Hmm tonight I my dashboards won't load. I can log in to tools and see my dashboard overview. But whenever I want to use one of my dashboards I continuously see the waiting circle.
Will try again tomorrow.
Posted
-
by
JeanTate
in response to jack9515's comment.
I think we're waiting for someone from the core ST or DT to drop by and let us know what's happening.
Posted
-
by
jack9515
Hmmmm ... Its magically working now.
Posted
-
for some reason (may be my operating system) when I classify galaxies and then click "yes" for would you like to discuss it, and after I'm done discussing it, I come back, and the picture is still there, but I cant click yes or no. The only way to get it to go away is when I refresh the screen. Help me JeanTate, you're my only hope! 😄
Posted
-
by
jules
moderator
in response to planetaryscience's comment.
There are one or two odd things happening with this new batch! I've noticed your problem too. Then there are the repeats, Every 14 galaxies or so a repeat appears. Also I've gone all the way through several classifications for the final click to not respond. The only way to move on is to refresh and lose the classification. Ah well - as there are no more galaxies to classify today I assume we are done.
Posted
-
by
JeanTate
in response to planetaryscience's comment.
If I'm your only hope, then we're all doomed! 😉
If I recall correctly, much the same sort of thing happened at the end of the first classification run: once every object had been classified enough times, it did this ... then the next day (or maybe it was just later the same day), Laura (or someone on the DT) changed a setting somewhere and you couldn't even get an object at all.
And I see that's pretty much what jules said too! 😃
Posted
-
also, I'm having a more extreme case now than what my post first said.
First of all, my galaxies repeated every 2-3 or so, and I only got ~14 last night.
another thing. After a while, I was only getting one galaxy over and over again
then lastly, I just couldn't classify galaxies as the whole classify area went down
is that regular/normal/supposed to happen? Is there any way to fix not being able to classify?
help me JeanTate, your my backup plan 😛Posted
-
 by
mlpeck
by
mlpeck
I think we're done classifying. Nothing happens when I click "classify".
Posted
-
by
Peter_Dzwig
How do you insert a dashboard or link to a dashboard. I think that there were some instructions somewhere but...
Posted
-
by
jules
moderator
On your dashboard "home page" (the one which lists all your dashboards) you have "view" "share" and "delete" options under each dashboard icon. Click "share," choose "url" and there's your link.
Posted
-
by
Peter_Dzwig
Thx.
Posted
-
by
jules
moderator
I haven't disappeared - I'm battling with Tools again.... 😄
It would be helpful if new data / table / plot windows opened on top of all other windows rather than underneath them all.
It would also be helpful if we could drag a window around by clicking anywhere on it. I can only move windows around by placing the cursor in a very small region on the title bar which is often hidden under a pile of other stuff.
Posted
-
by
jules
moderator
Also - could the "-" and "x" for displaying/hiding and deleting a plot or table be placed at opposite ends of the title bars? I very nearly did something silly....
Posted
-
by
trouille
scientist, moderator, admin
Yes! To both of these. And provides a good spot to say -- Tools is getting a facelift! .. in terms of user-friendliness. The developers have been reading these posts and getting a lot of additional feedback and have taken much of it to heart. It's been interesting seeing the science and computer-science community work together to design a better user interface. There's definitely some things that computer scientists feel very strongly about that don't make complete sense to me (for example, not wanting any tutorials at all, since the user-interface should be so obvious that no tutorial is needed). Luckily Quench experience has helped provide some guidance -- so here's to hoping for a successful facelift! I'll post here when it's going to go live.
Posted
-
by
jules
moderator
A few more Tools comments:
-
I still have to wait too long for the tables to populate after launching a dashboard (between 1 -2 minutes!) If it takes longer (often) I have to refresh - and then wait again. This morning I am on my third refresh as I write this and I still have blank tables. (I use windows Vista and latest Firefox - same in XP and Firefox,)
-
I've been working with a main table which I apply different filters to and a series of sub-tables which take their data from this main table. I have found that the filter changes do not automatically transfer to the sub-tables and I have to refresh every time I change the filter on the main table. When you have to do this 24 times to get all the values for a plot it gets very frustrating!
-
It would be good to be able to organise dashboards into groups / folders. I have so many it's becoming tricky to find what I want.
-
Mentioned before but could the "-" and "x" for displaying/hiding and deleting a plot or table be placed at opposite ends of the title bars? I have actually deleted tables in error!
-
We can only drag tables around when the data source window is closed (by clicking the "comb" icon). It would be useful if this worked when the window is open.
-
New tables / histograms etc usually appear underneath all other work. Could they appear on top by default?
-
It would be so useful to be able to download tables directly from Tools.
Posted
-
-
by
JeanTate
in response to trouille's comment.
In light of jules' comments earlier today, it would be nice to be informed when significant changes are made, especially if any of those changes involve fixing functionality previously noted to be absent or seriously deficient.
There's definitely some things that computer scientists feel very strongly about that don't make complete sense to me (for example, not wanting any tutorials at all, since the user-interface should be so obvious that no tutorial is needed).
It would be nice if at least one of those computer scientists could engage in a discussion of things like this, with us ordinary zooites. Two areas - just as examples - of where a productive dialog would be good:
- for whatever reason, the common mathematical symbols for 'greater than' and 'less than' cannot be used (or at least not easily) ... why? what to do instead?
- ordinary zooites have a wide range of experiences and skills when it comes to the sorts of analyses which Tools permits ... it may indeed make sense for these folk, as a community, to learn by discovery and within-the-community explanations (etc); can we at least have a discussion about it?
Posted
-
by
JeanTate
Differences between v5 QS and QC catalogs and their v4 counterparts is a thread I just started. It concerns two sets of files I downloaded from Tools. As such, that thread is very much about Tools. Particularly about the 'front end', i.e. how data are loaded into the databases Tools uses, and how the quality and versioning of that data is managed.
An excerpt from the OP which SCIENTISTs reading this may find, um, disturbing:
Much, much worse is the suspicion that this apparent sloppiness can be found in quality control over data in other Zooniverse projects ... how corrupt are the 'click databases'?
Posted
-
by
ChrisMolloy
in response to JeanTate's comment.
Thank you for your examination into this. I've held off doing the log mass/redshift analysis till these issues are resolved. And yes, I was a bit perturbed (maybe a bit more) by what you found.
Posted