New Board
-
 by
wassock
moderator
by
wassock
moderator
Thought that there ought to be a place to Chat about the tools and data analysis phase.
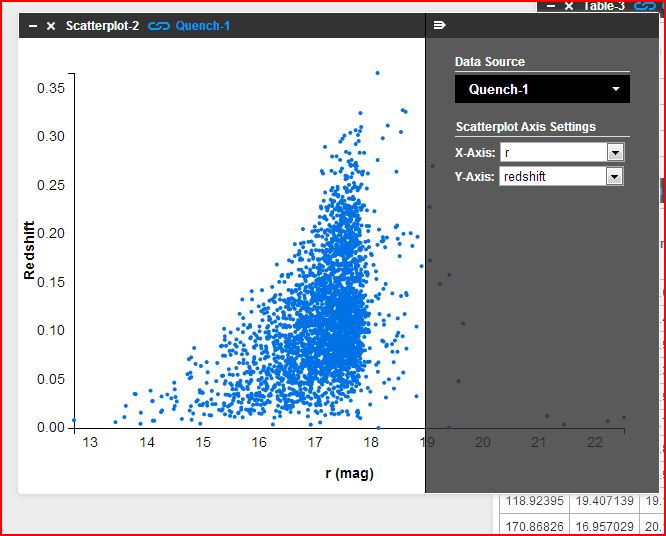
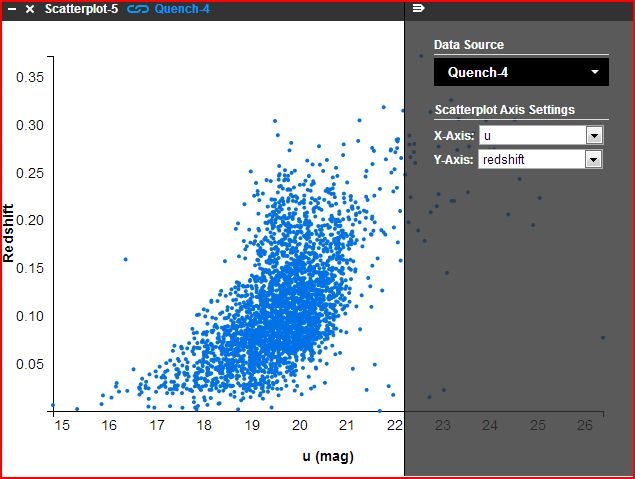
First up - plotting redshift against the various magnitudes g, r, i, z shows a clear 'upper limit' of magnitude for each band at between 19 and 21 ( with what we'll call outliers for now above that. The same holds for both the sample and control groups, in the u band the limit is still there but less well defined for the sample group but not really there for the control. So why the limit and why is the u band different?
Posted
-
by
wassock
moderator
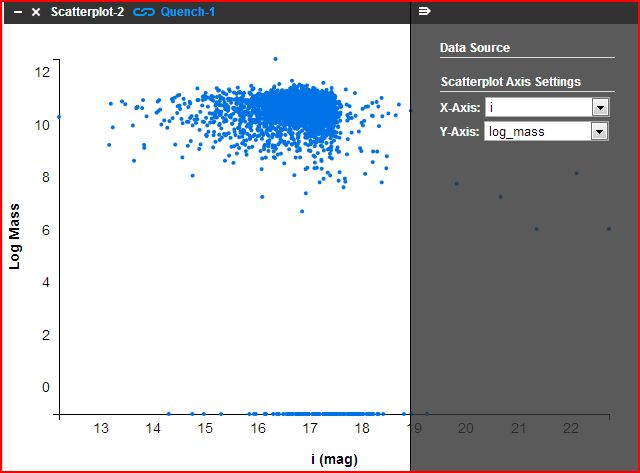
There also seems to be a glass ceiling for log_mass, plotting one against the other gives oddly rightangled groupings:
Posted
-
 by
JeanTate
in response to wassock's comment.
by
JeanTate
in response to wassock's comment.
Once a member of the QP ST tells us what the selection criteria, and stategies, were, for the QS and QC datasets, the answers will become much clearer (ditto to your question about the glass ceiling for log(mass)).
In the meantime:
- QS and QC objects must have SDSS spectra; in DR7, that means the r-band magnitude is < 17.77 (caveat outliers, which applies to every bullet)
- the 'u band exceptionalism' is not real; the fuzzier limit is due to the fact that the objects have a wide range of (u-r) colors (I'll see if I can make a plot to show this)
- I suspect that all the galaxies with r band mags of between 17.77 and 19.5 are 'red ellipticals'; these fainter galaxies were selected, in DR7, for a particular purpose (source):
Two deeper samples of luminous red ellipticals selected in color–magnitude space to r = 19.2 and r = 19.5,
respectively, which produce an approximately volume limited sample to z = 0.38, and a flux-limited sample extending to z = 0.55, respectively (Eisenstein et al. 2001).Posted
-
by
wassock
moderator
in response to JeanTate's comment.
Guess I'm asking the same question (how did the galaxies get picked) in a less direct way - I'm assuming that a random selection of galaxies would not show this distribution,so is it caused by the selection criteria or has it something to do with quenching? (please remember I'm asking questions without the benefit of any understanding of what is going on so they may be treated as truly idiot questions,pray, humour me)
Posted
-
by
JeanTate
in response to wassock's comment.
There are no 'truly idiot questions'! 😃
In extra-galactic astronomy, 'selection criteria' is everything. So far there's just one - rather tantalizing, but not very precise - answer, re how was QS selected, Principal Component Analysis involving spectral features (and more?). When you have some spare time (hah!), read up on Malmquist biasWP. That explains some of the features in your first two plots. The rather flat distribution in your third one (logmass vs i) may be a consequence of the selection criteria, but the almost complete lack of any massive galaxies may be an interesting find. More generally, yes, for a given mass (within limits!) it is possible to find galaxies with observed frame i-band mags as bright as 12, and as faint as ... well, certainly far fainter than the limit that comes from the r-band limit of 17.77!
Posted
-
by
wassock
moderator
in response to JeanTate's comment.
- it's just the way one asks them....
In the logmass/i plot and the ones for the other bands its the way there is a clear top and right side to the distribution that strikes me
Posted